> ## Documentation Index
> Fetch the complete documentation index at: https://docs.reown.com/llms.txt
> Use this file to discover all available pages before exploring further.
# Analytics
## What is the Reown Analytics feature?
Reown offers in-depth analytics so you can track your project's progress. Explore your users' behavior, including their origin countries, wallet providers, hours most active and more. Or dive into the details about the total number and volume of swaps and onramps you've enabled. With Reown Analytics, you have the power to make data-driven decisions to take your app to the next level.
## How to find Reown Analytics
### See your project's analytics
To access Reown Analytics for your project, follow these simple steps:
1. Log in to the [Reown Dashboard](https://dashboard.reown.com/sign-in).
2. Click on your Project.
3. Click the **Analytics** tab.
4. Pick the Analytics page you would like to view: either **User Activity**, **Swaps** or **Onramps**.
The Analytics pages show in-depth insights into your app's performance.
### See your team's Usage
To track your RPC usage or total MAUs, follow these steps:
1. Log in to the [Reown Dashboard](https://dashboard.reown.com/sign-in).
2. Select the team you want to check in the top left hand corner.
3. Click on the **Usage** tab.
The Usage tab shows your team's total RPC calls and MAUs in the past 30 days, including any overage.
## Understanding Reown Project Analytics
### User Activity
Under the **User Activity** tab, you'll find in-depth data about your users and how they are interacting with your app.
#### Total Users
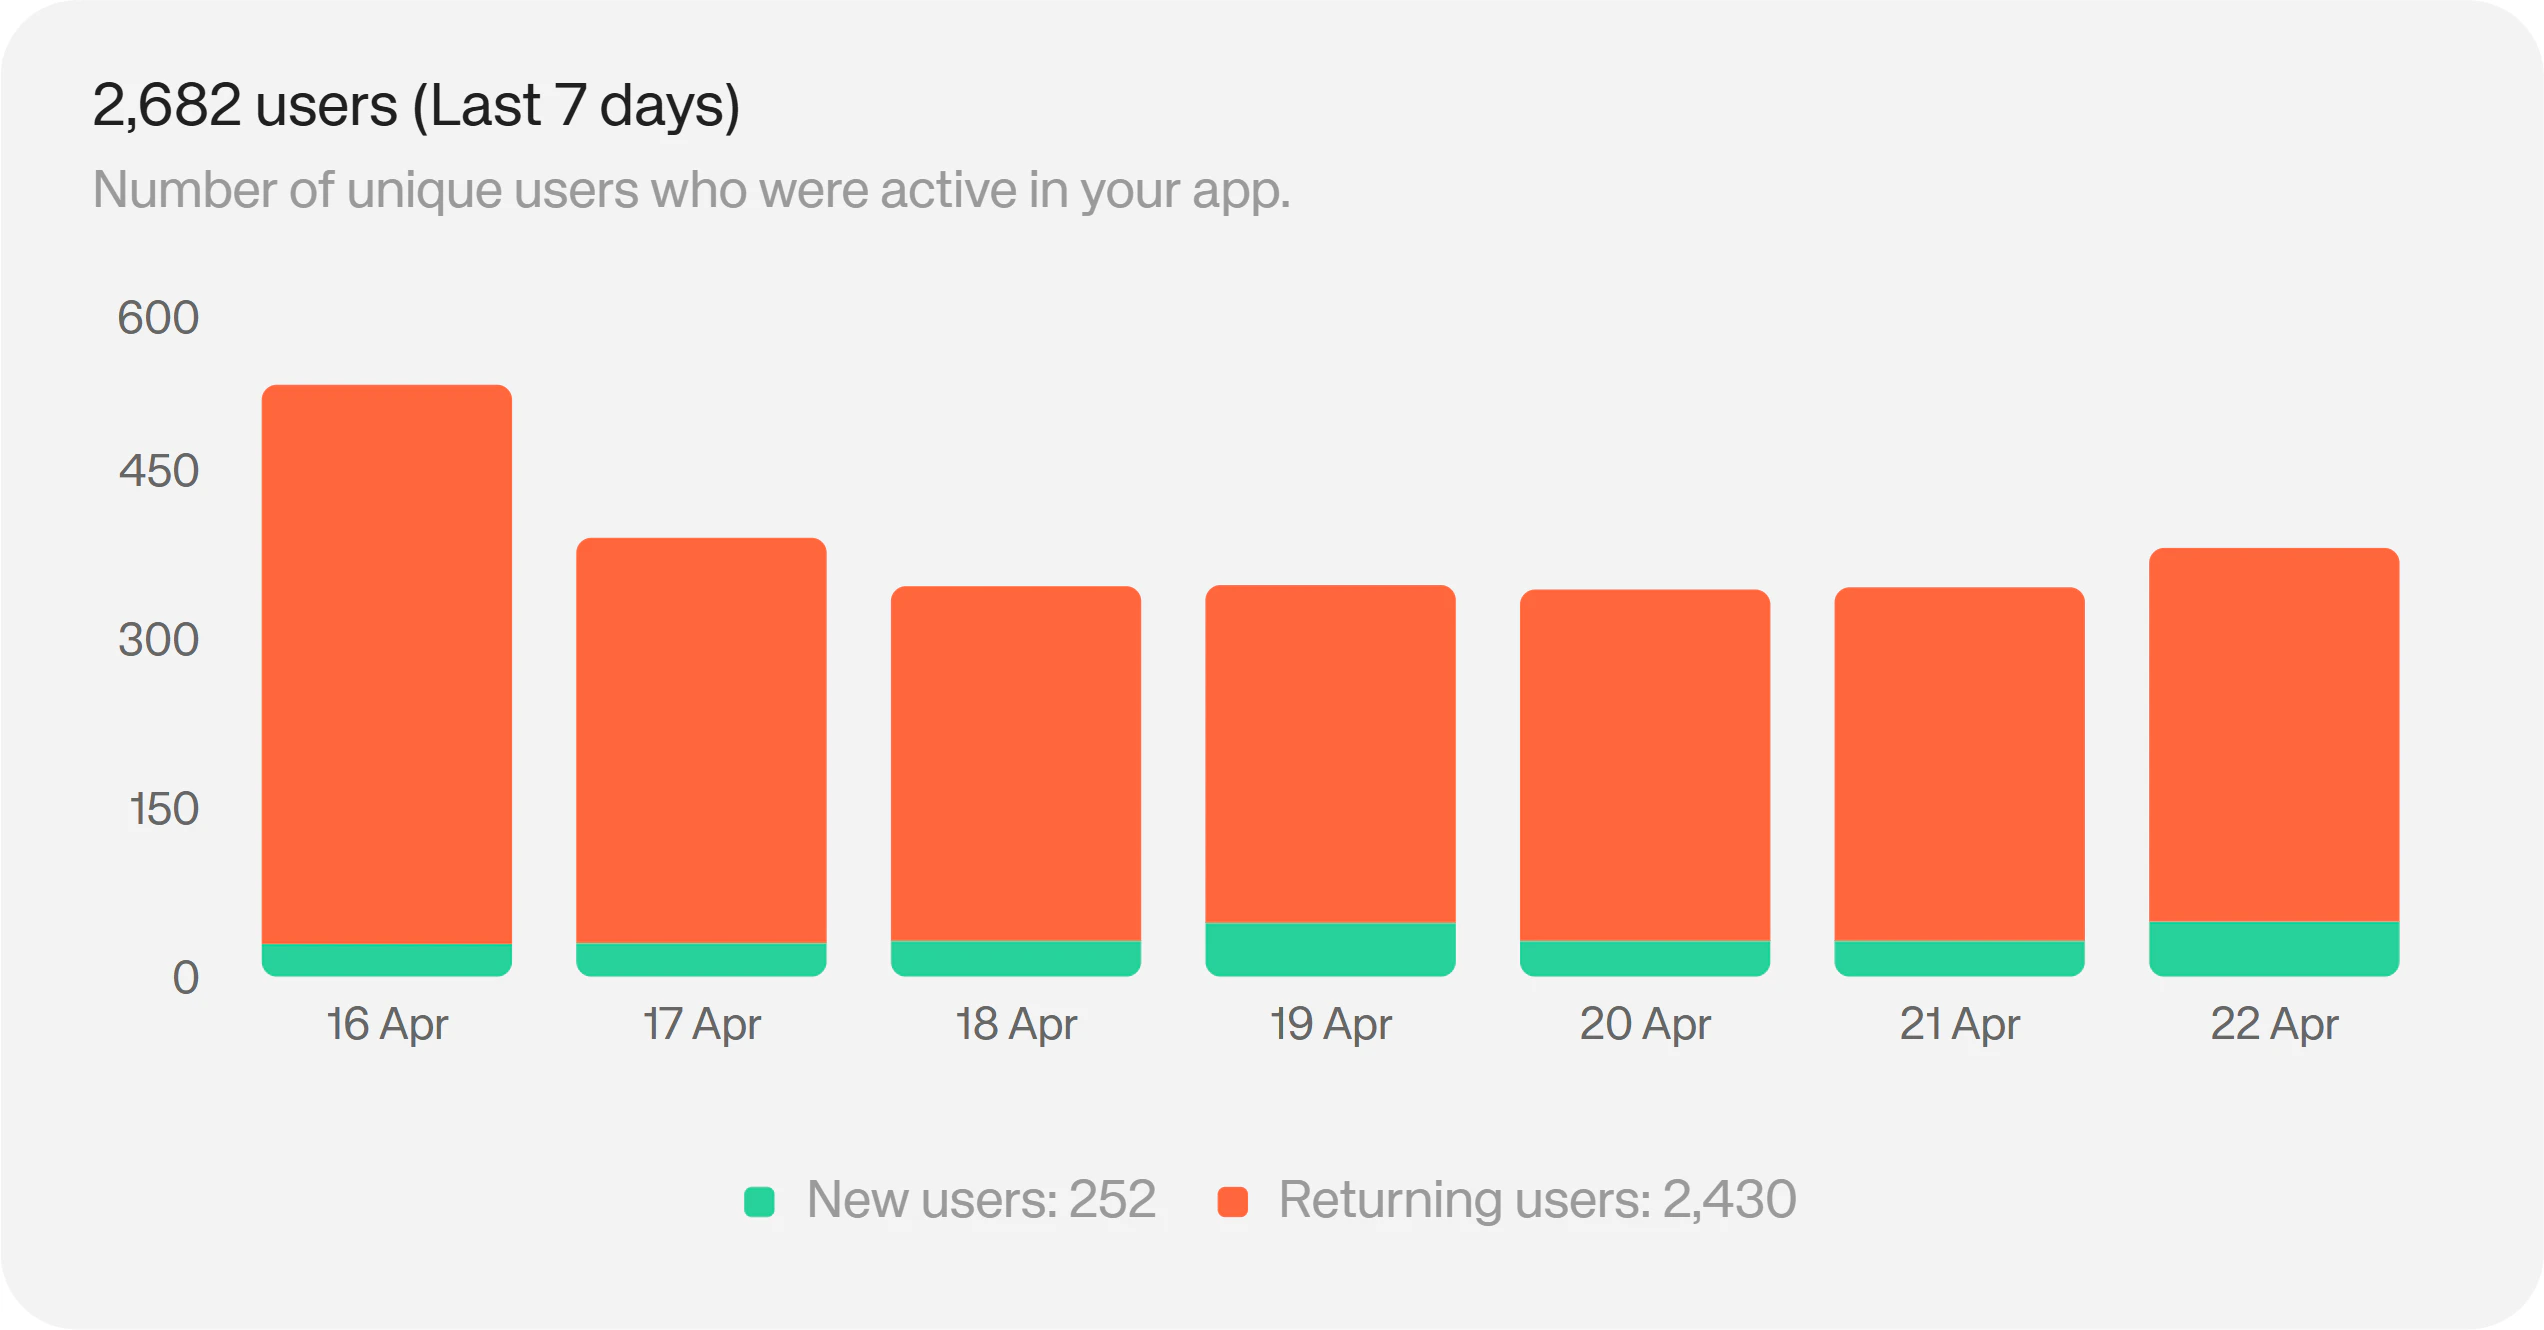
The total users chart shows you how many users you've served during a specific period.
On Starter and Pro, you have access to the 7 day history. On Enterprise, you have the full history of total users, filterable by Week, Month, Quarter, Year or All time.
 #### Sessions vs Wallet Connection
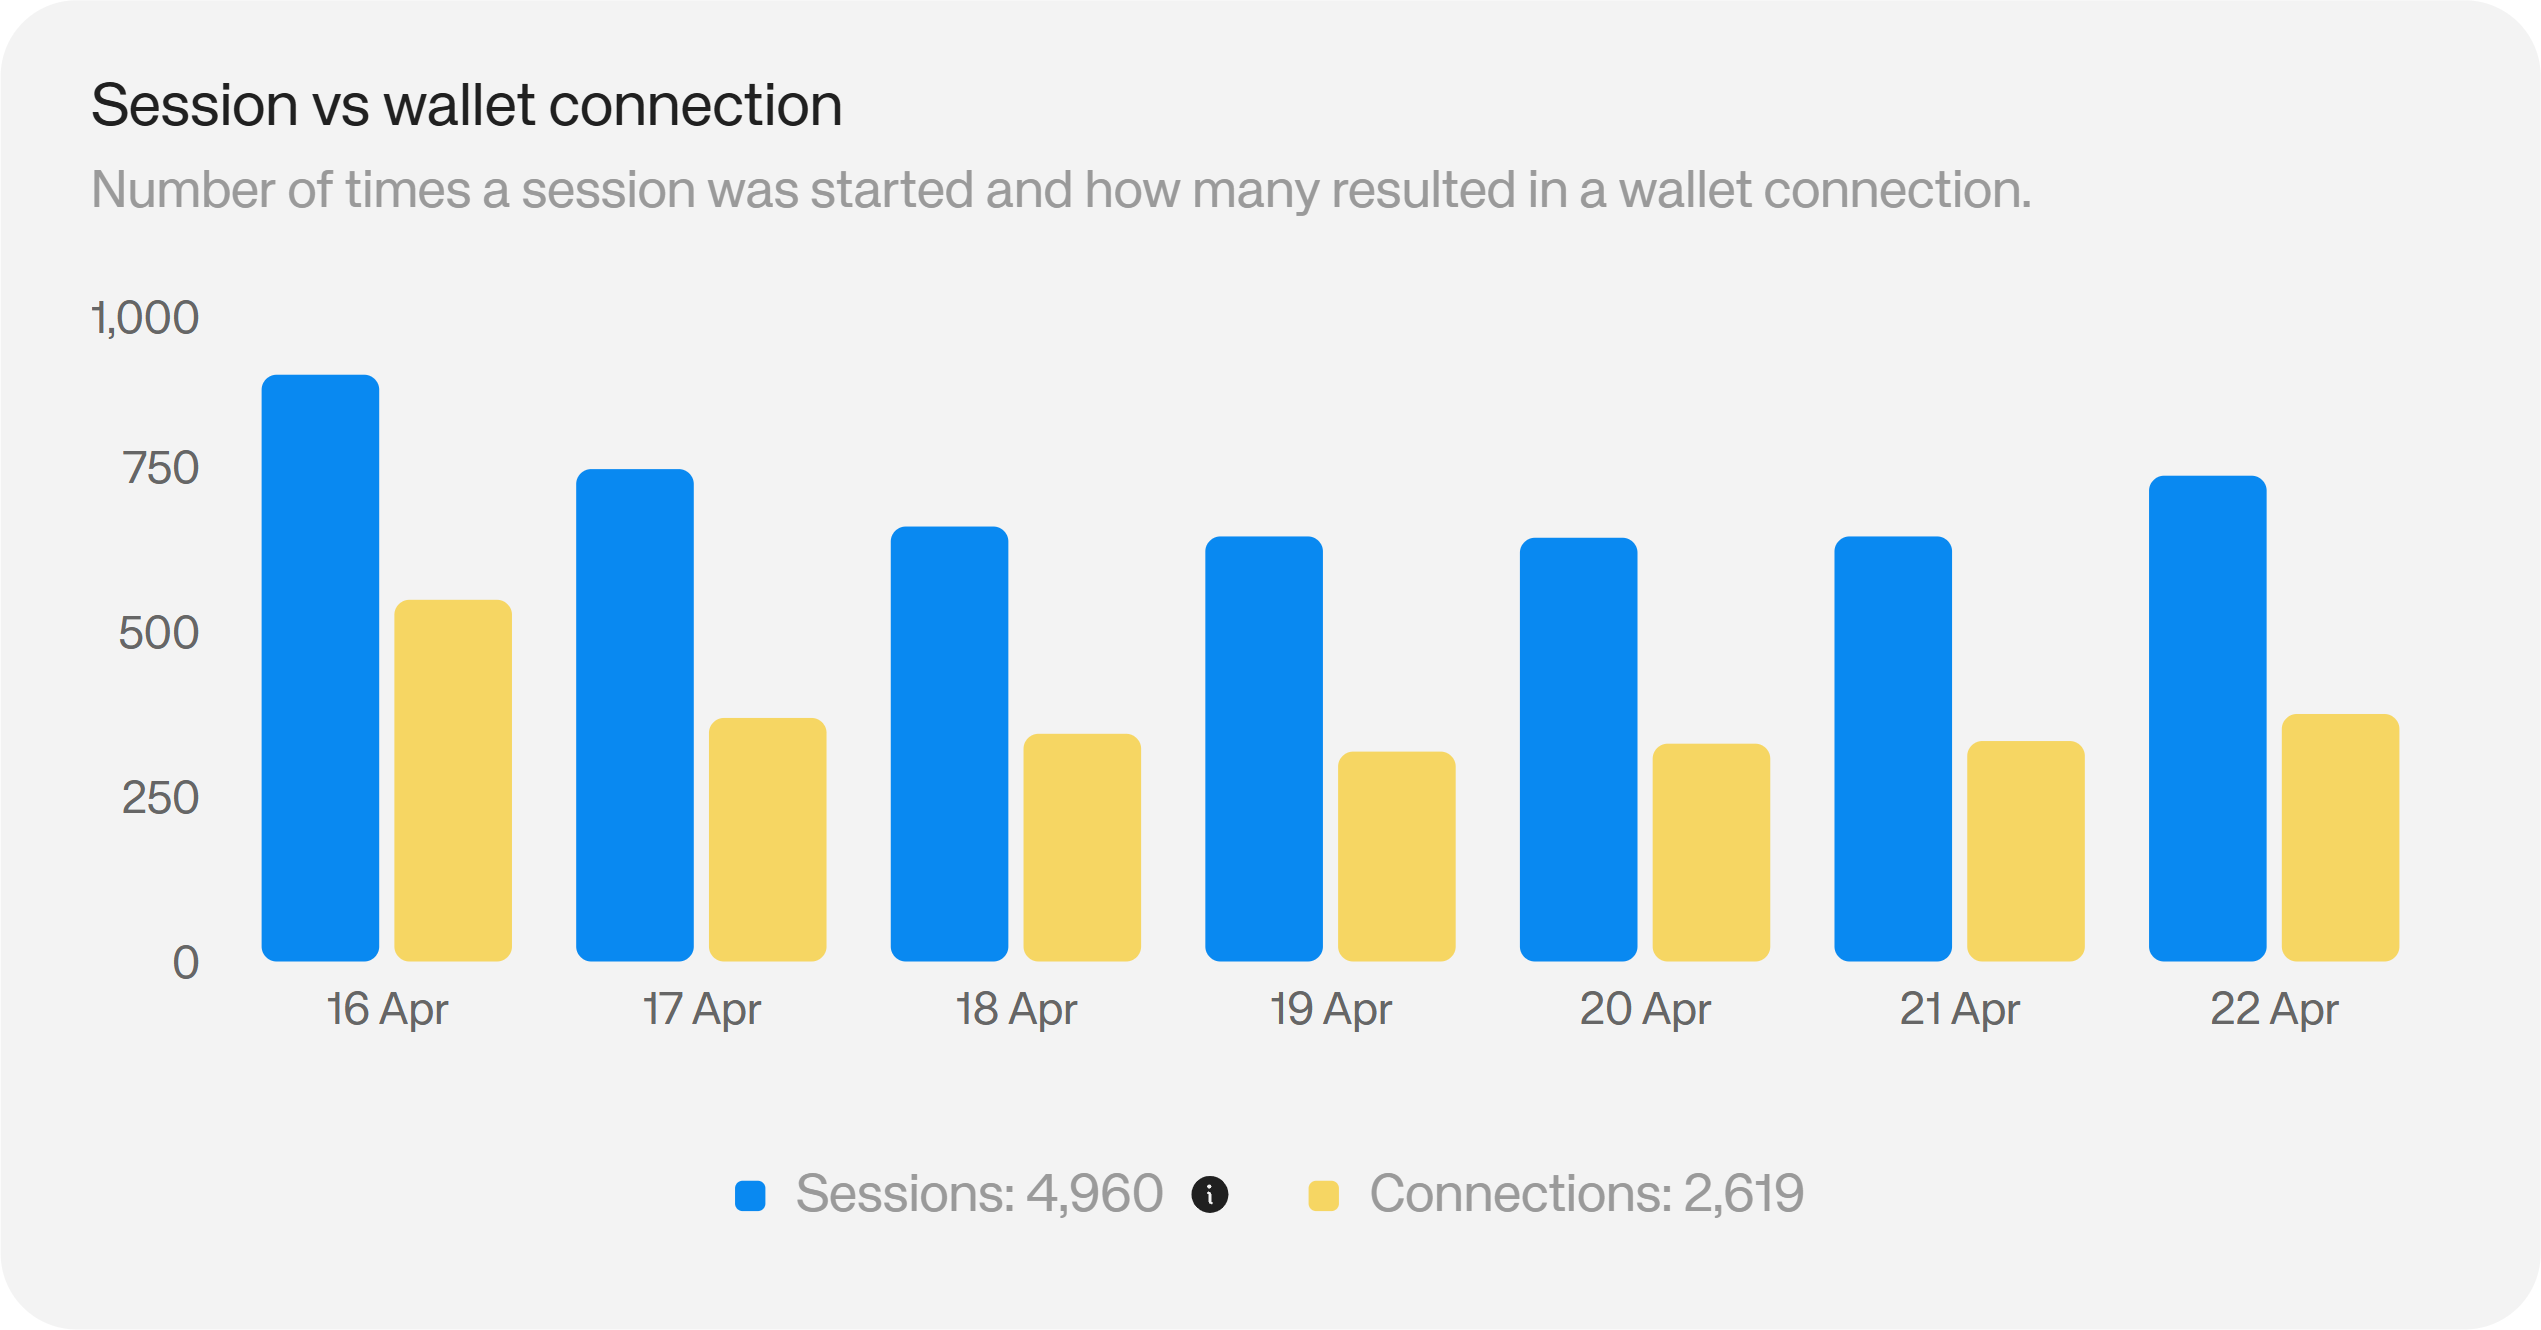
The sessions vs wallet connection chart shows you how many times a session was started and how many of those sessions resulted in a wallet connection.
On Starter and Pro, you have access to the 7 day history. On Enterprise, you have the full history, filterable by Week, Month, Quarter, Year or All time.
#### Sessions vs Wallet Connection
The sessions vs wallet connection chart shows you how many times a session was started and how many of those sessions resulted in a wallet connection.
On Starter and Pro, you have access to the 7 day history. On Enterprise, you have the full history, filterable by Week, Month, Quarter, Year or All time.
 #### Total Signatures
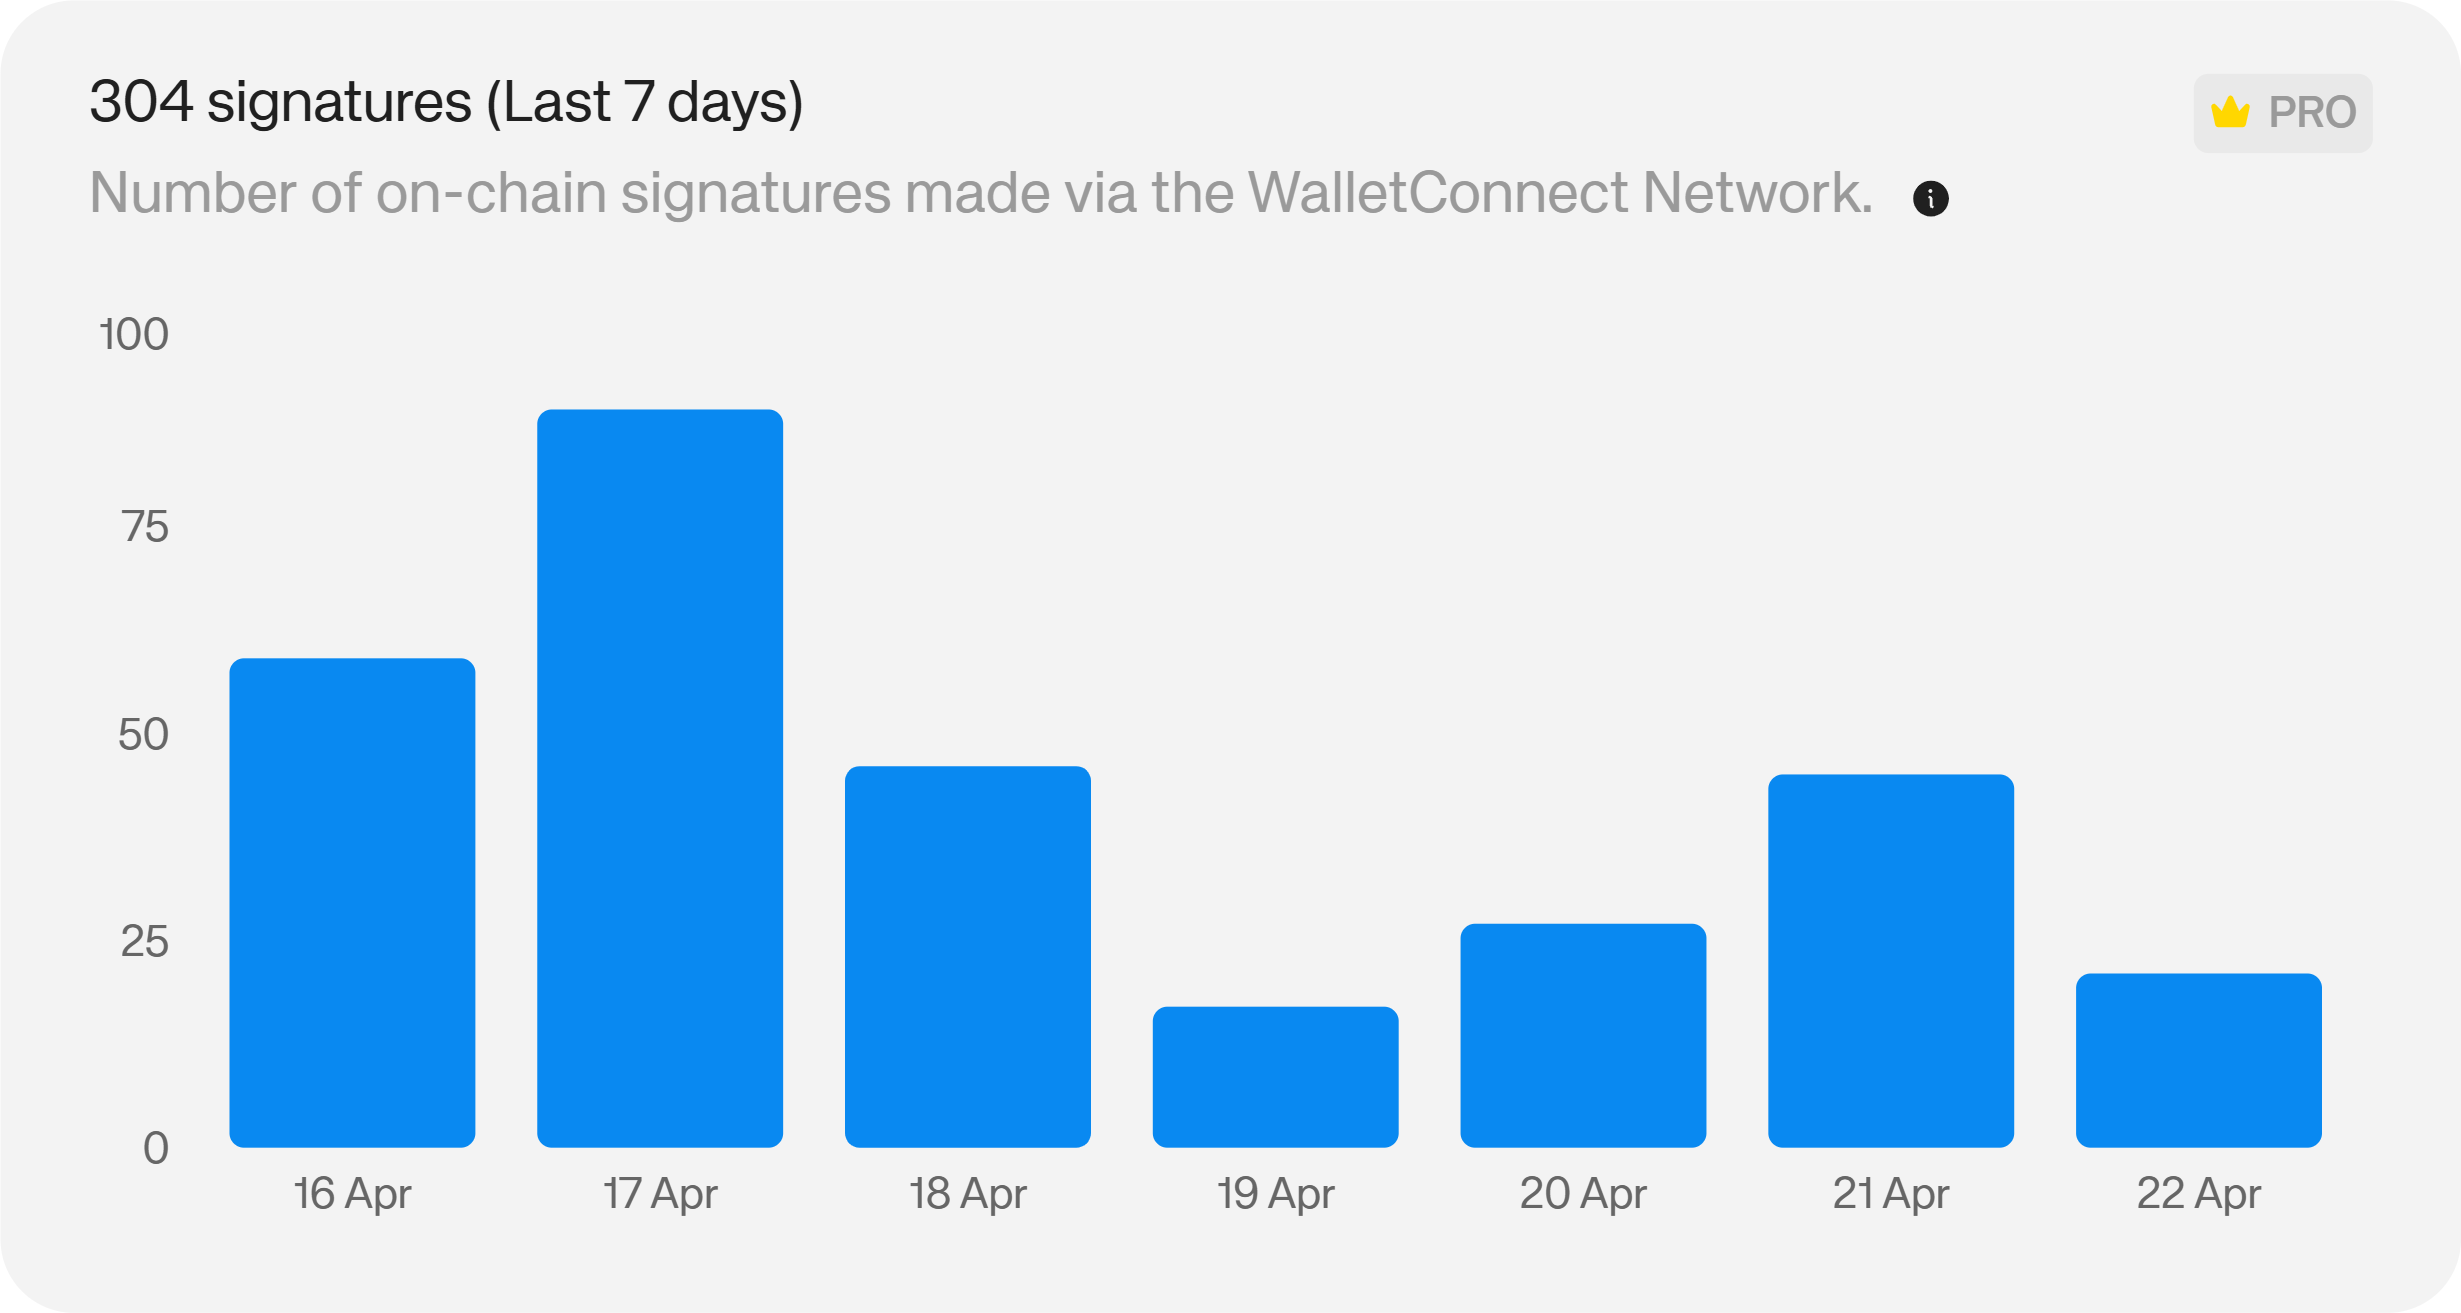
The total signatures chart shows you the number of transaction signatures your users have made in a given period.
On Pro, you have access to the 7 day history. On Enterprise, you have the full history, filterable by Week, Month, Quarter, Year or All time. (Not available on Starter plans)
#### Total Signatures
The total signatures chart shows you the number of transaction signatures your users have made in a given period.
On Pro, you have access to the 7 day history. On Enterprise, you have the full history, filterable by Week, Month, Quarter, Year or All time. (Not available on Starter plans)
 #### Active Hours
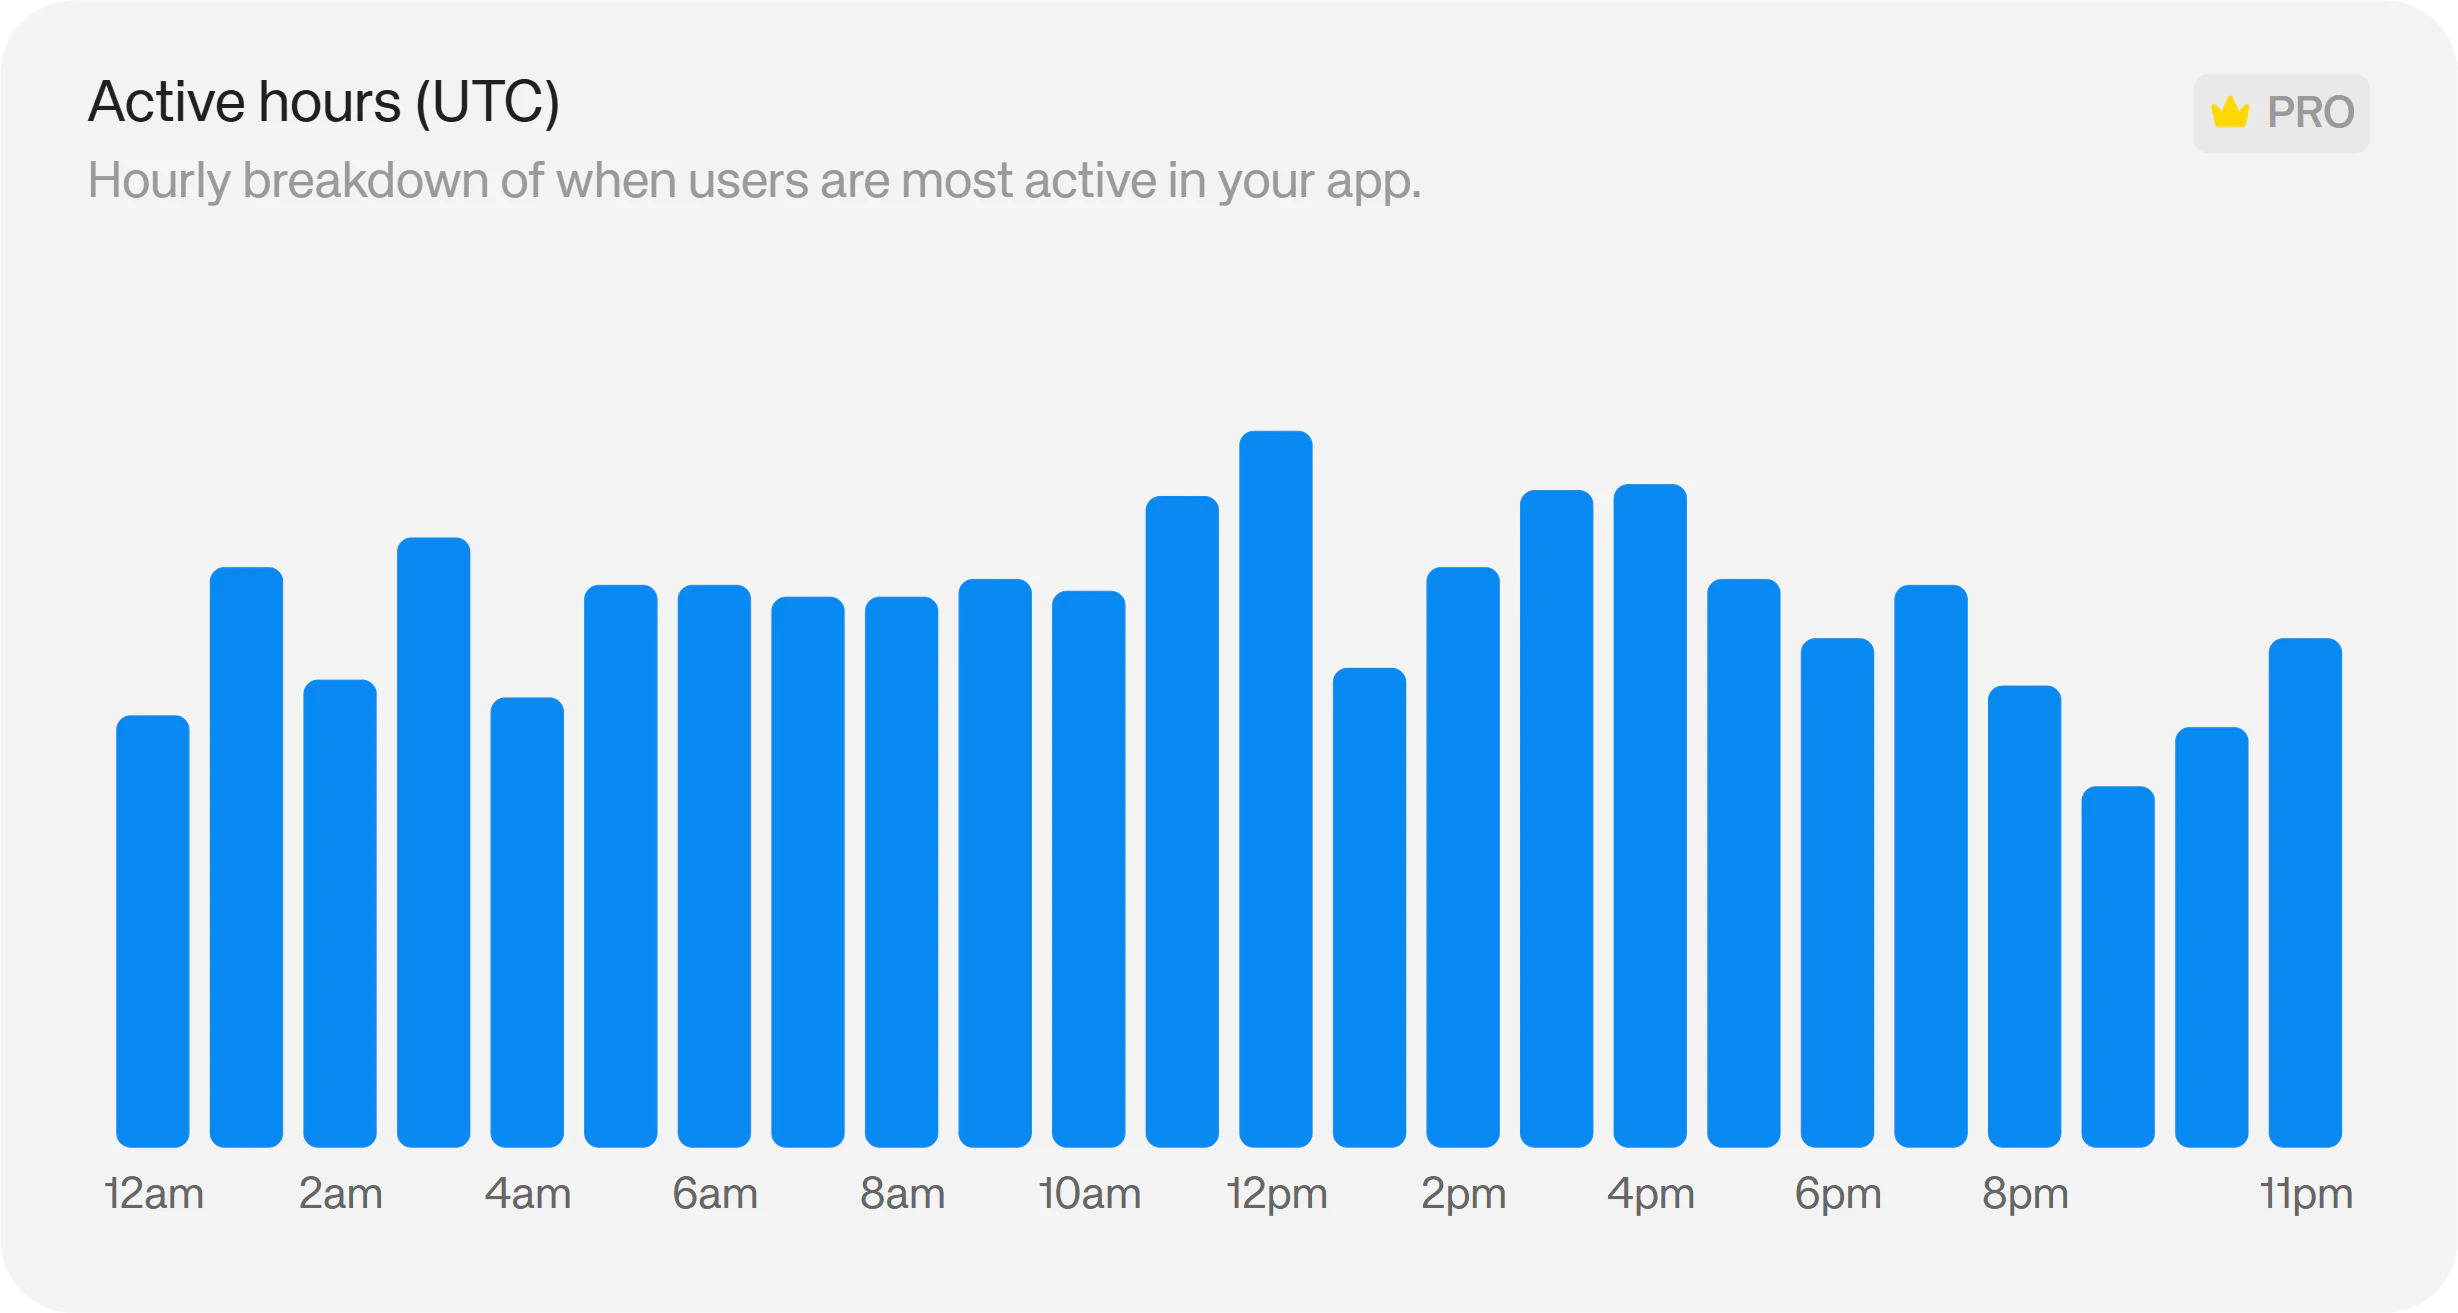
The active hours chart shows you which hours of the day your users are most active. Available on Pro and Enterprise plans. (Not available on Starter plans)
#### Active Hours
The active hours chart shows you which hours of the day your users are most active. Available on Pro and Enterprise plans. (Not available on Starter plans)
 #### Operating Systems
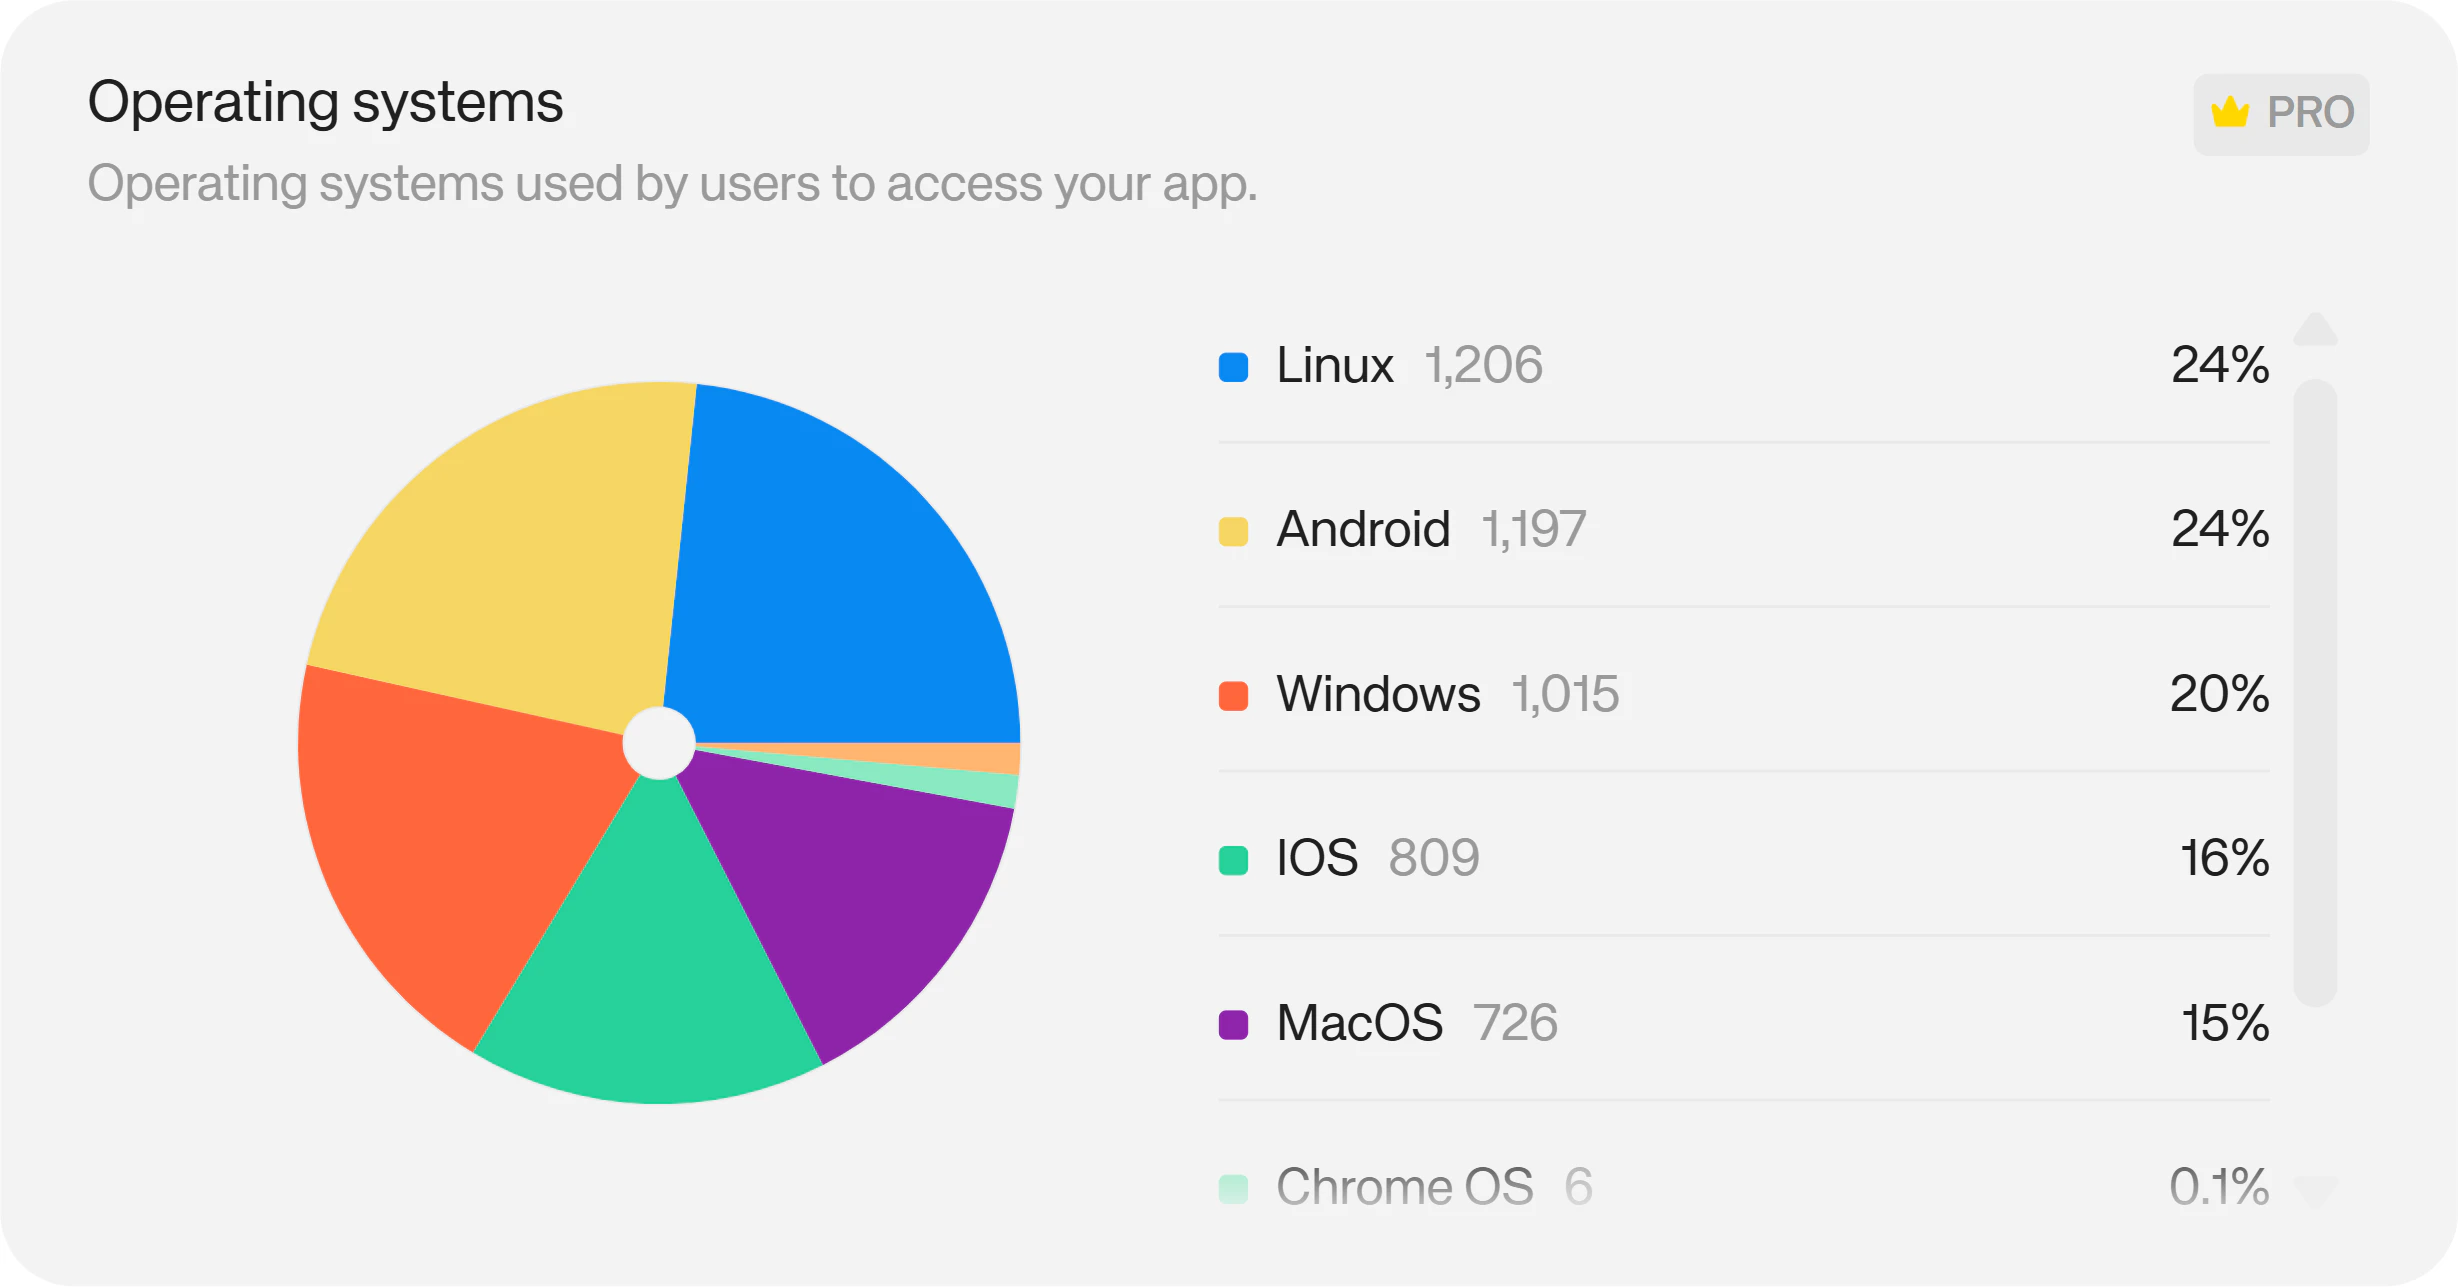
The operating systems chart breaks down which operating systems your users access your app from. Available on Pro and Enterprise plans. (Not available on Starter plans)
#### Operating Systems
The operating systems chart breaks down which operating systems your users access your app from. Available on Pro and Enterprise plans. (Not available on Starter plans)
 #### Networks
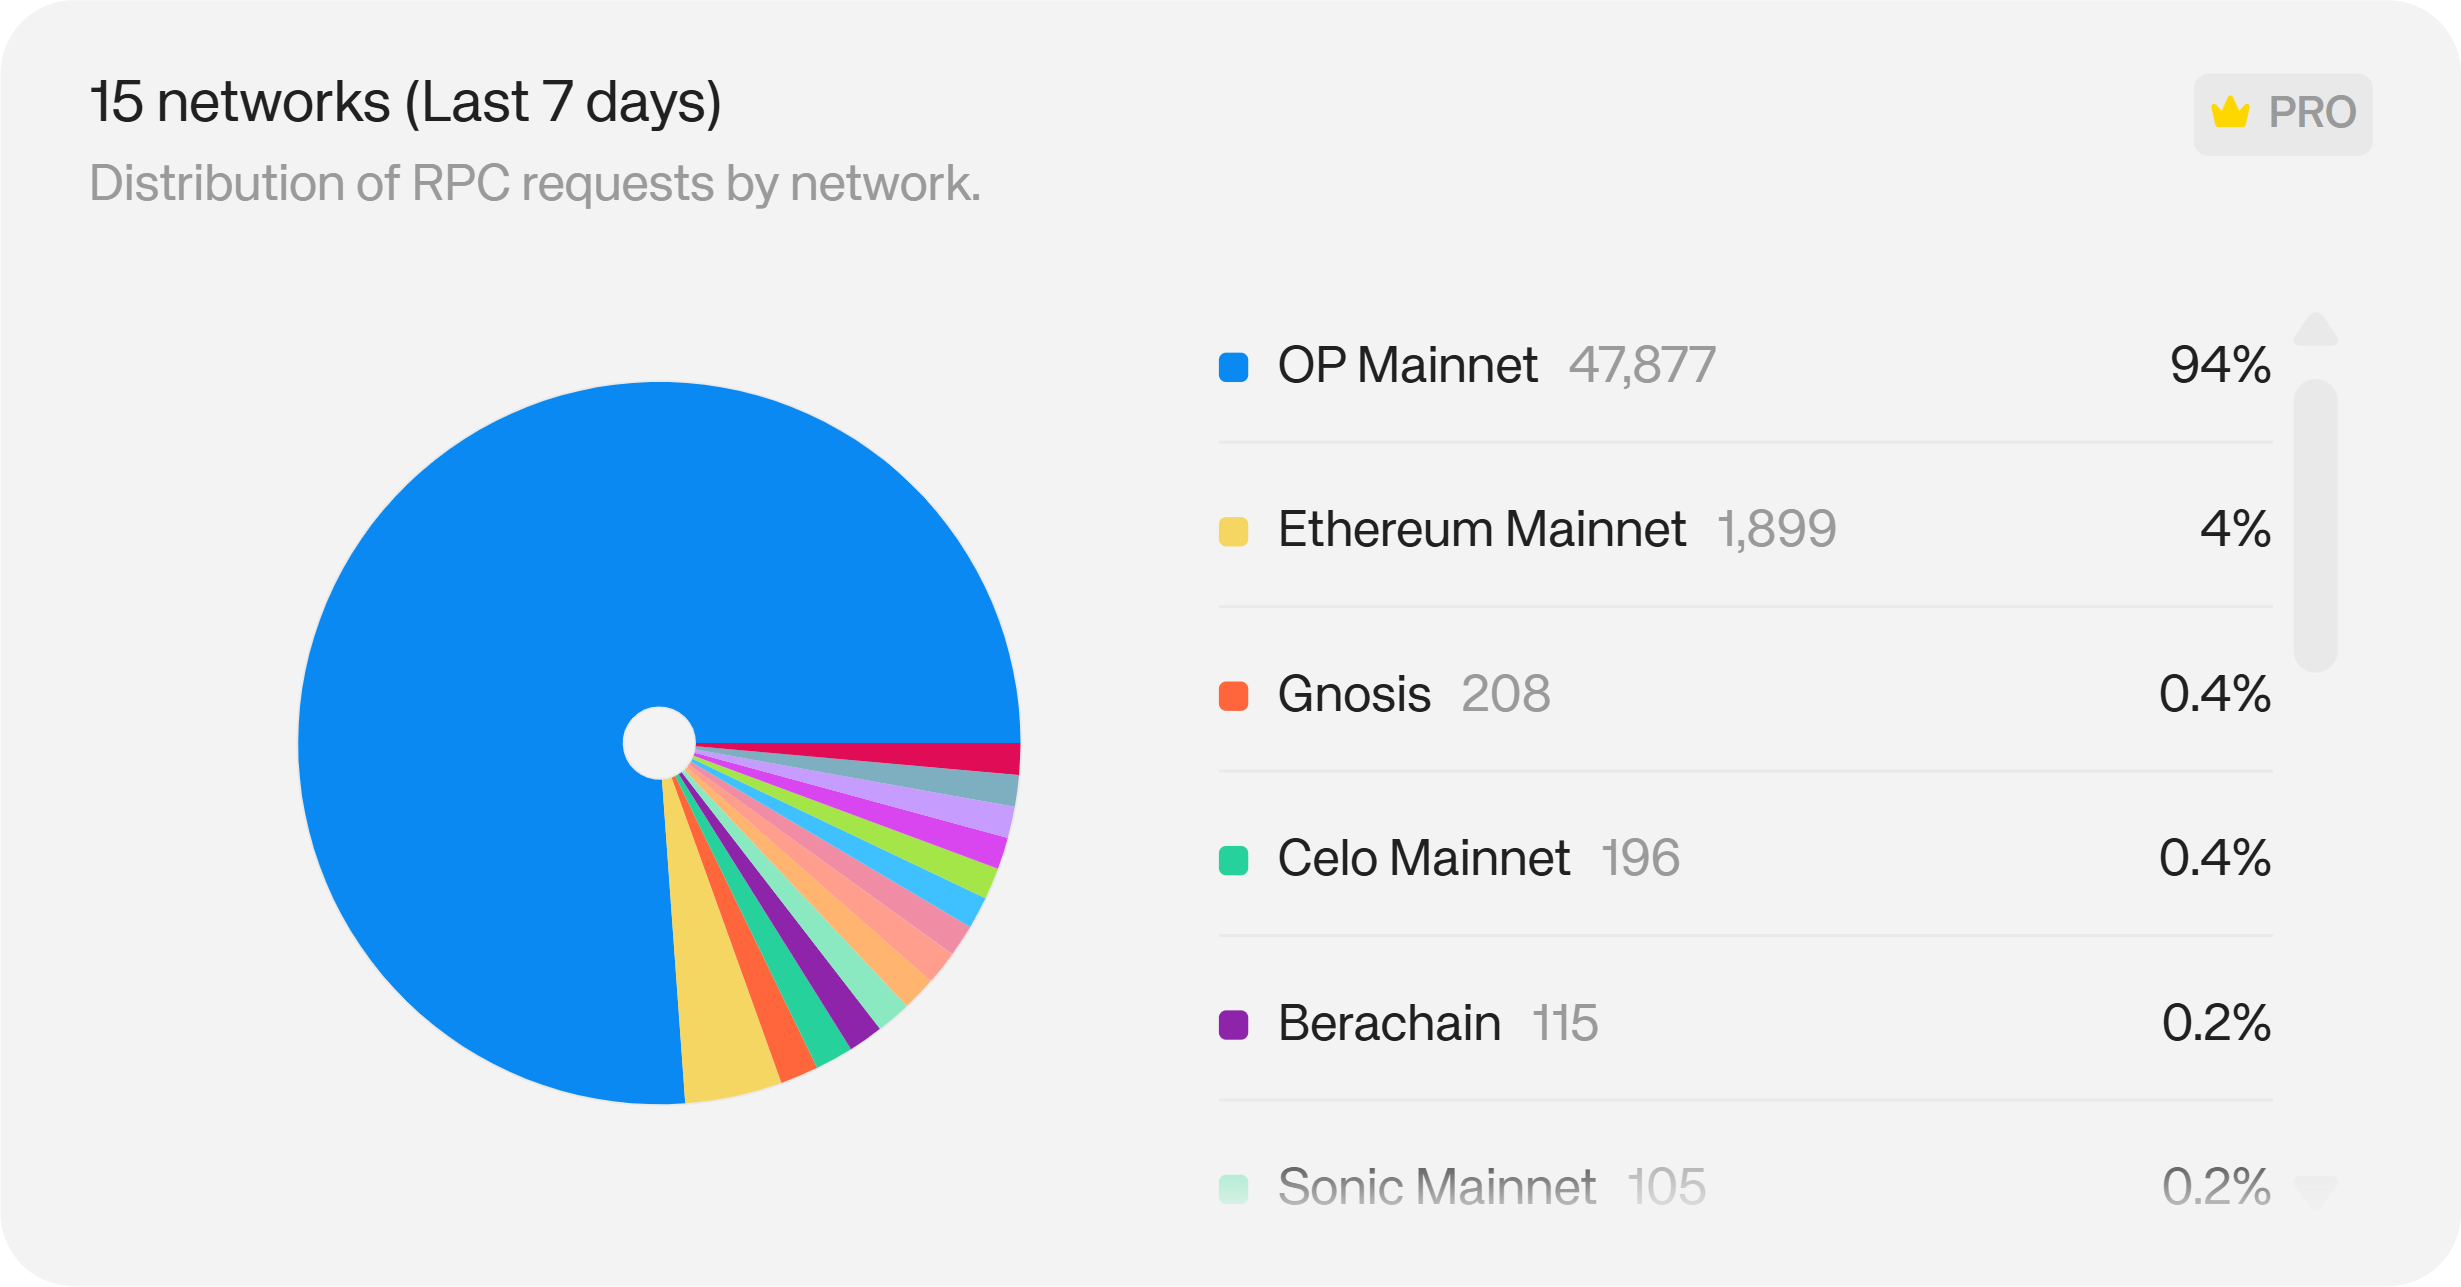
The Networks chart shows you the top networks your users access your app through.
On Pro, you have access to the 7 day history. On Enterprise, you have the full history, filterable by Week, Month, Quarter, Year or All time. (Not available on Starter plans)
#### Networks
The Networks chart shows you the top networks your users access your app through.
On Pro, you have access to the 7 day history. On Enterprise, you have the full history, filterable by Week, Month, Quarter, Year or All time. (Not available on Starter plans)
 #### Connection Methods
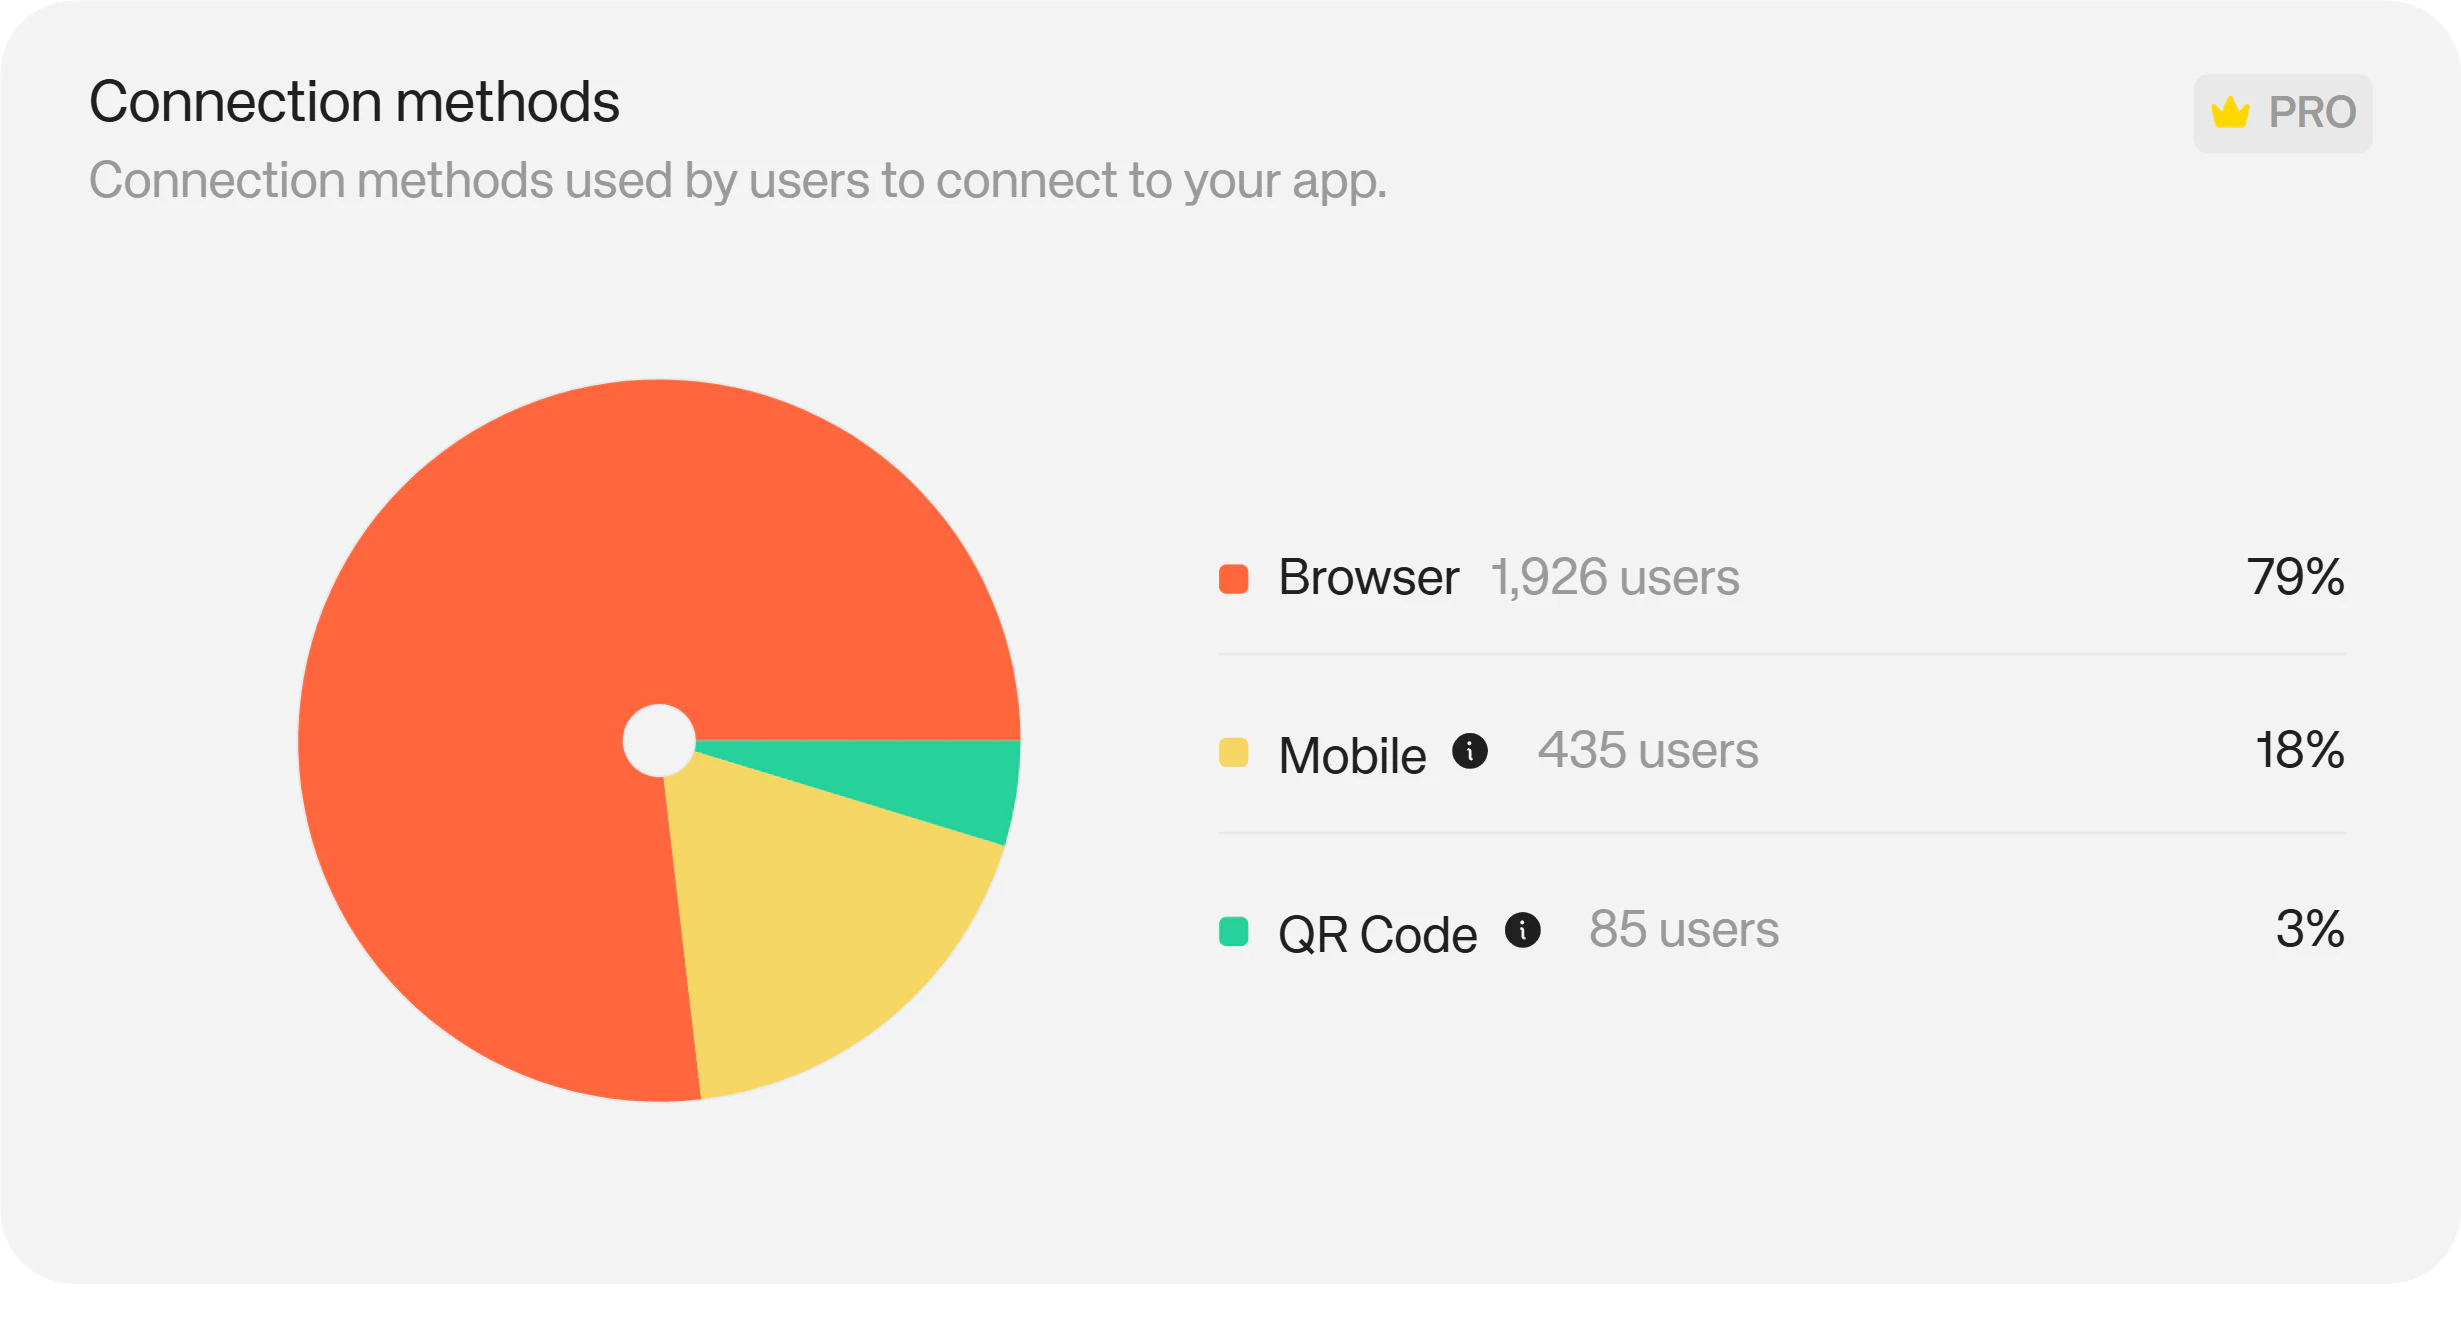
The Connection methods chart shows you how users log in to your app, either via browser, mobile or QR code.
Available on Pro and Enterprise plans. (Not available on Starter plans)
#### Connection Methods
The Connection methods chart shows you how users log in to your app, either via browser, mobile or QR code.
Available on Pro and Enterprise plans. (Not available on Starter plans)
 #### Social Login Providers
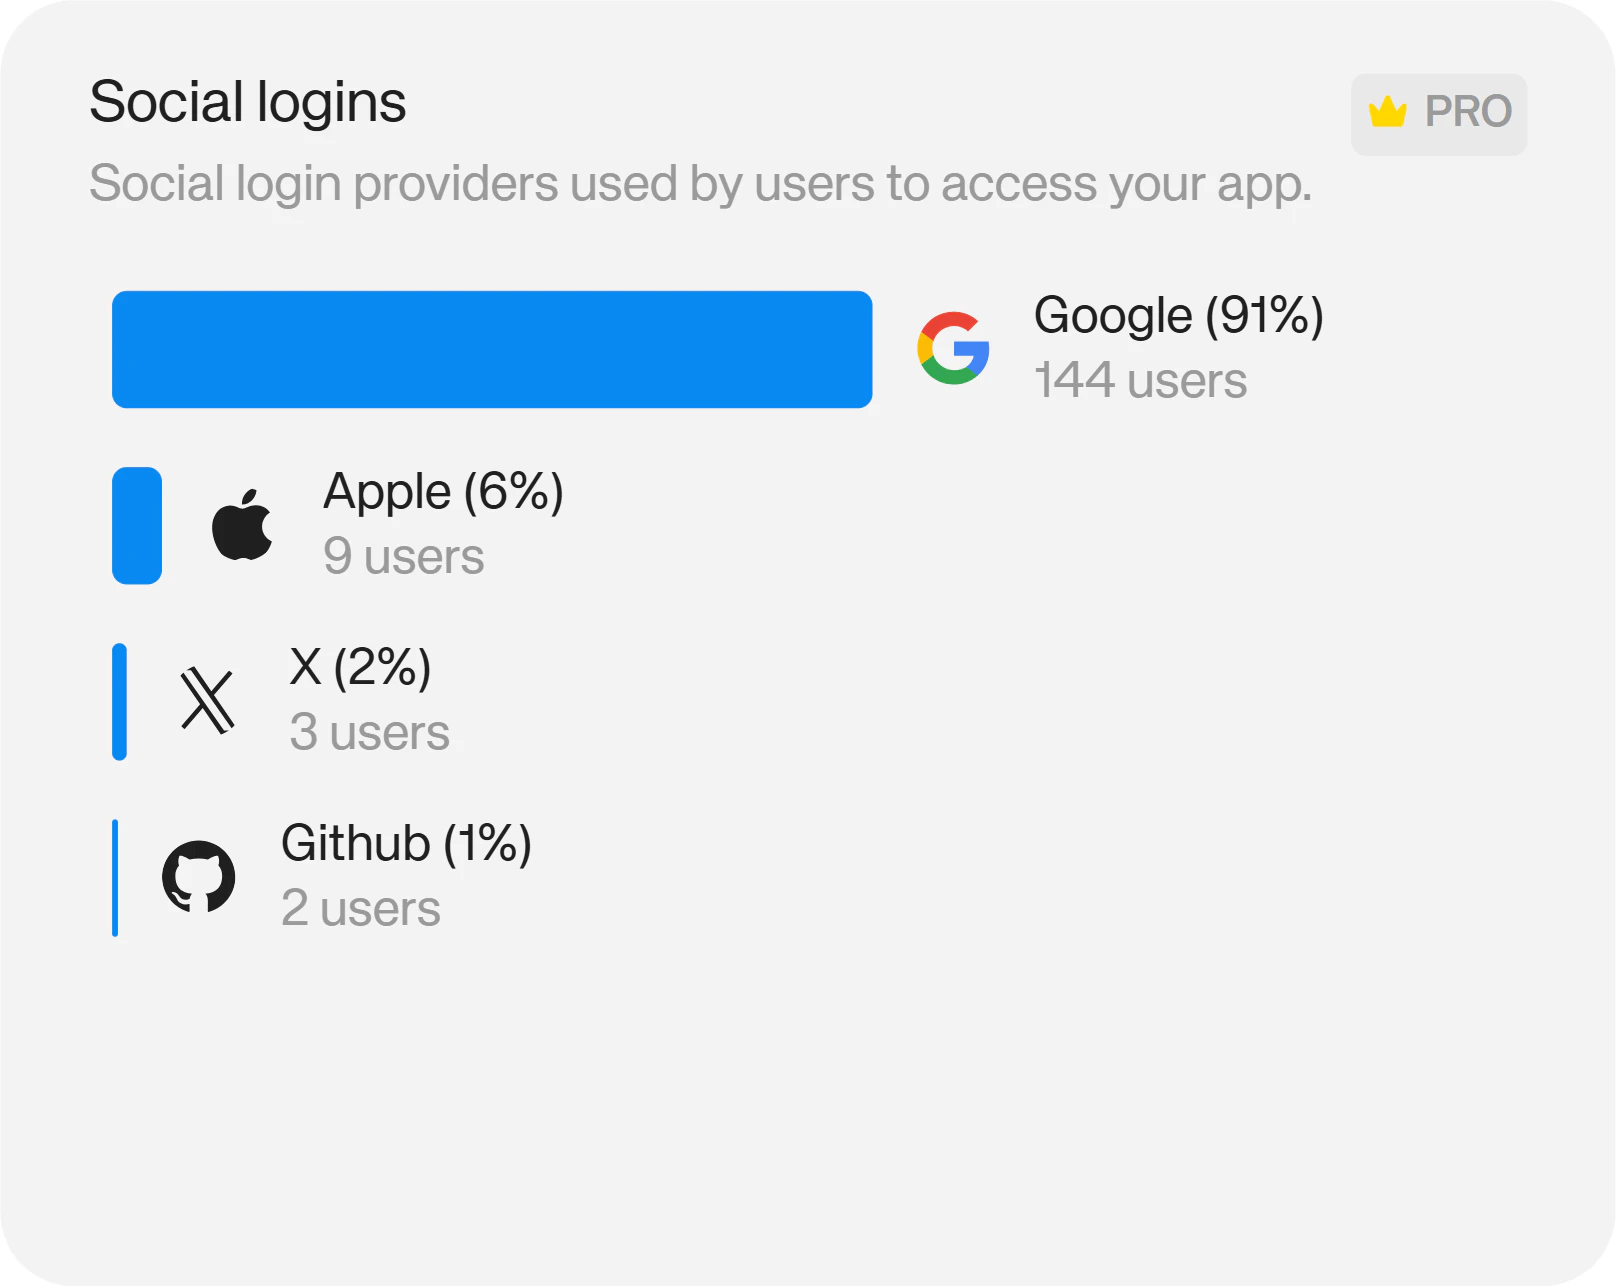
The social logins chart shows you your users' top social or email login methods.
Available on Pro and Enterprise plans. (Not available on Starter plans)
#### Social Login Providers
The social logins chart shows you your users' top social or email login methods.
Available on Pro and Enterprise plans. (Not available on Starter plans)
 #### Wallet Providers
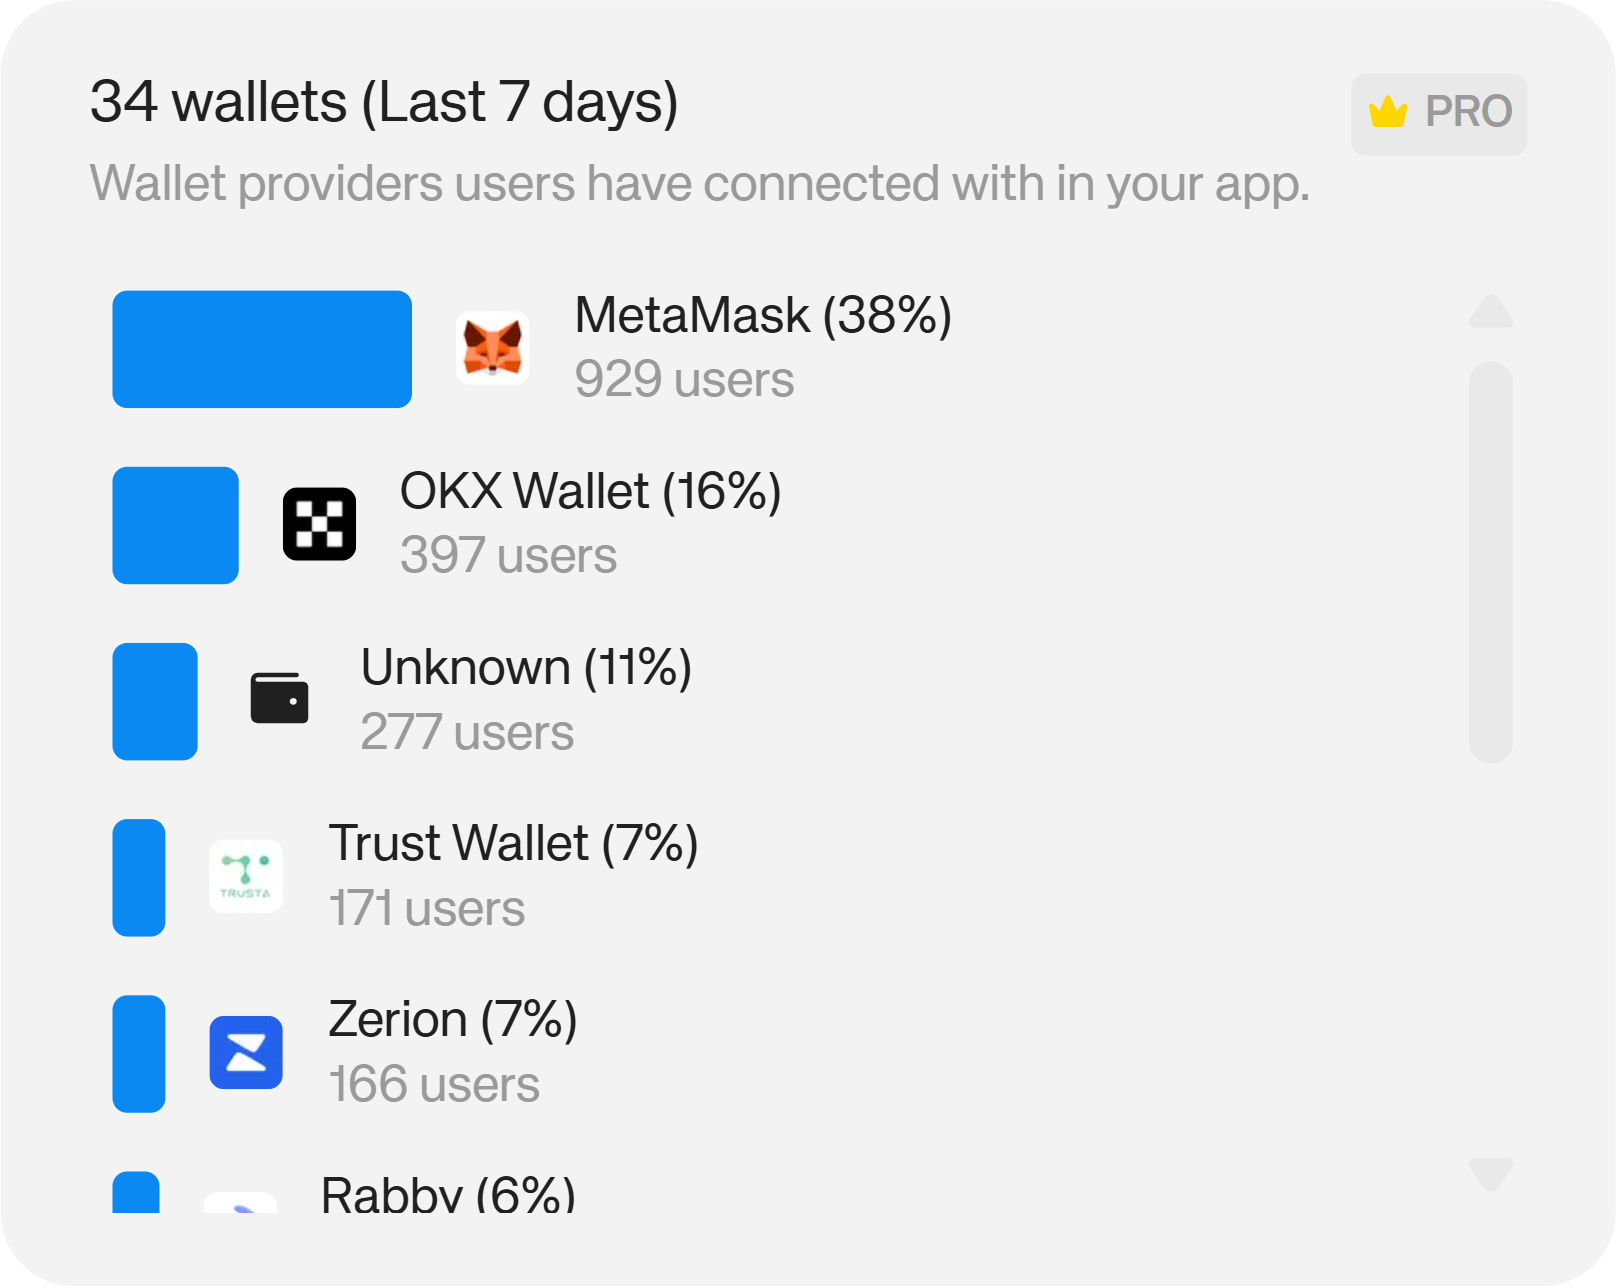
The Wallets chart shows you which wallet providers your users are connecting to your app with. Available on Pro and Enterprise plans. (Not available on Starter plans)
#### Wallet Providers
The Wallets chart shows you which wallet providers your users are connecting to your app with. Available on Pro and Enterprise plans. (Not available on Starter plans)
 #### Top Countries
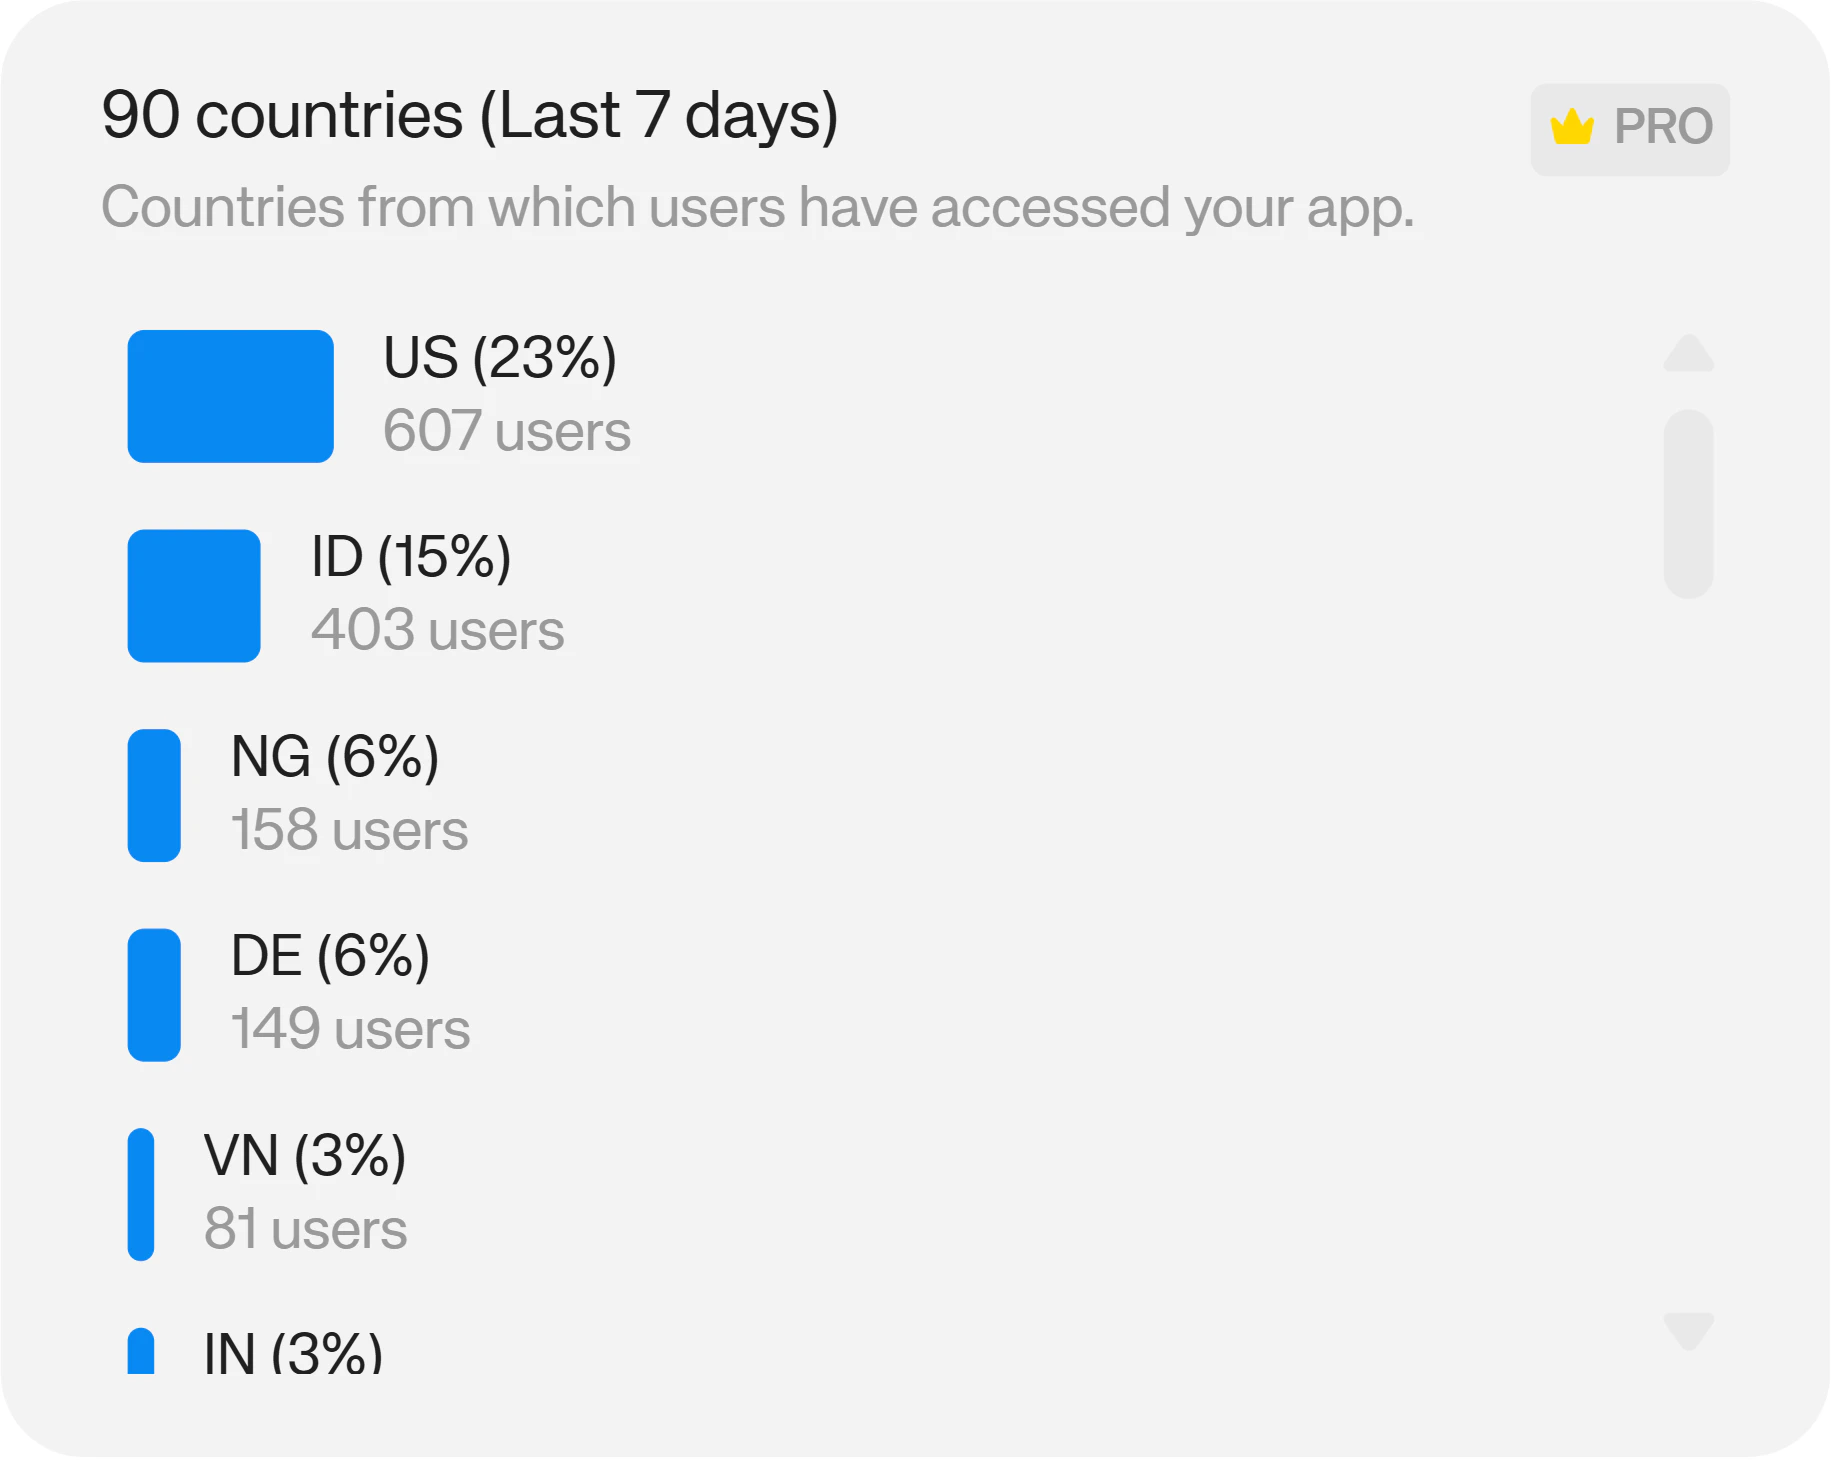
The countries chart shows you where in the world your users are connecting to your app from.
On Pro, you have access to the 7 day history. On Enterprise, you have the full history, filterable by Week, Month, Quarter, Year or All time. (Not available on Starter plans)
#### Top Countries
The countries chart shows you where in the world your users are connecting to your app from.
On Pro, you have access to the 7 day history. On Enterprise, you have the full history, filterable by Week, Month, Quarter, Year or All time. (Not available on Starter plans)
 #### User Net Worth
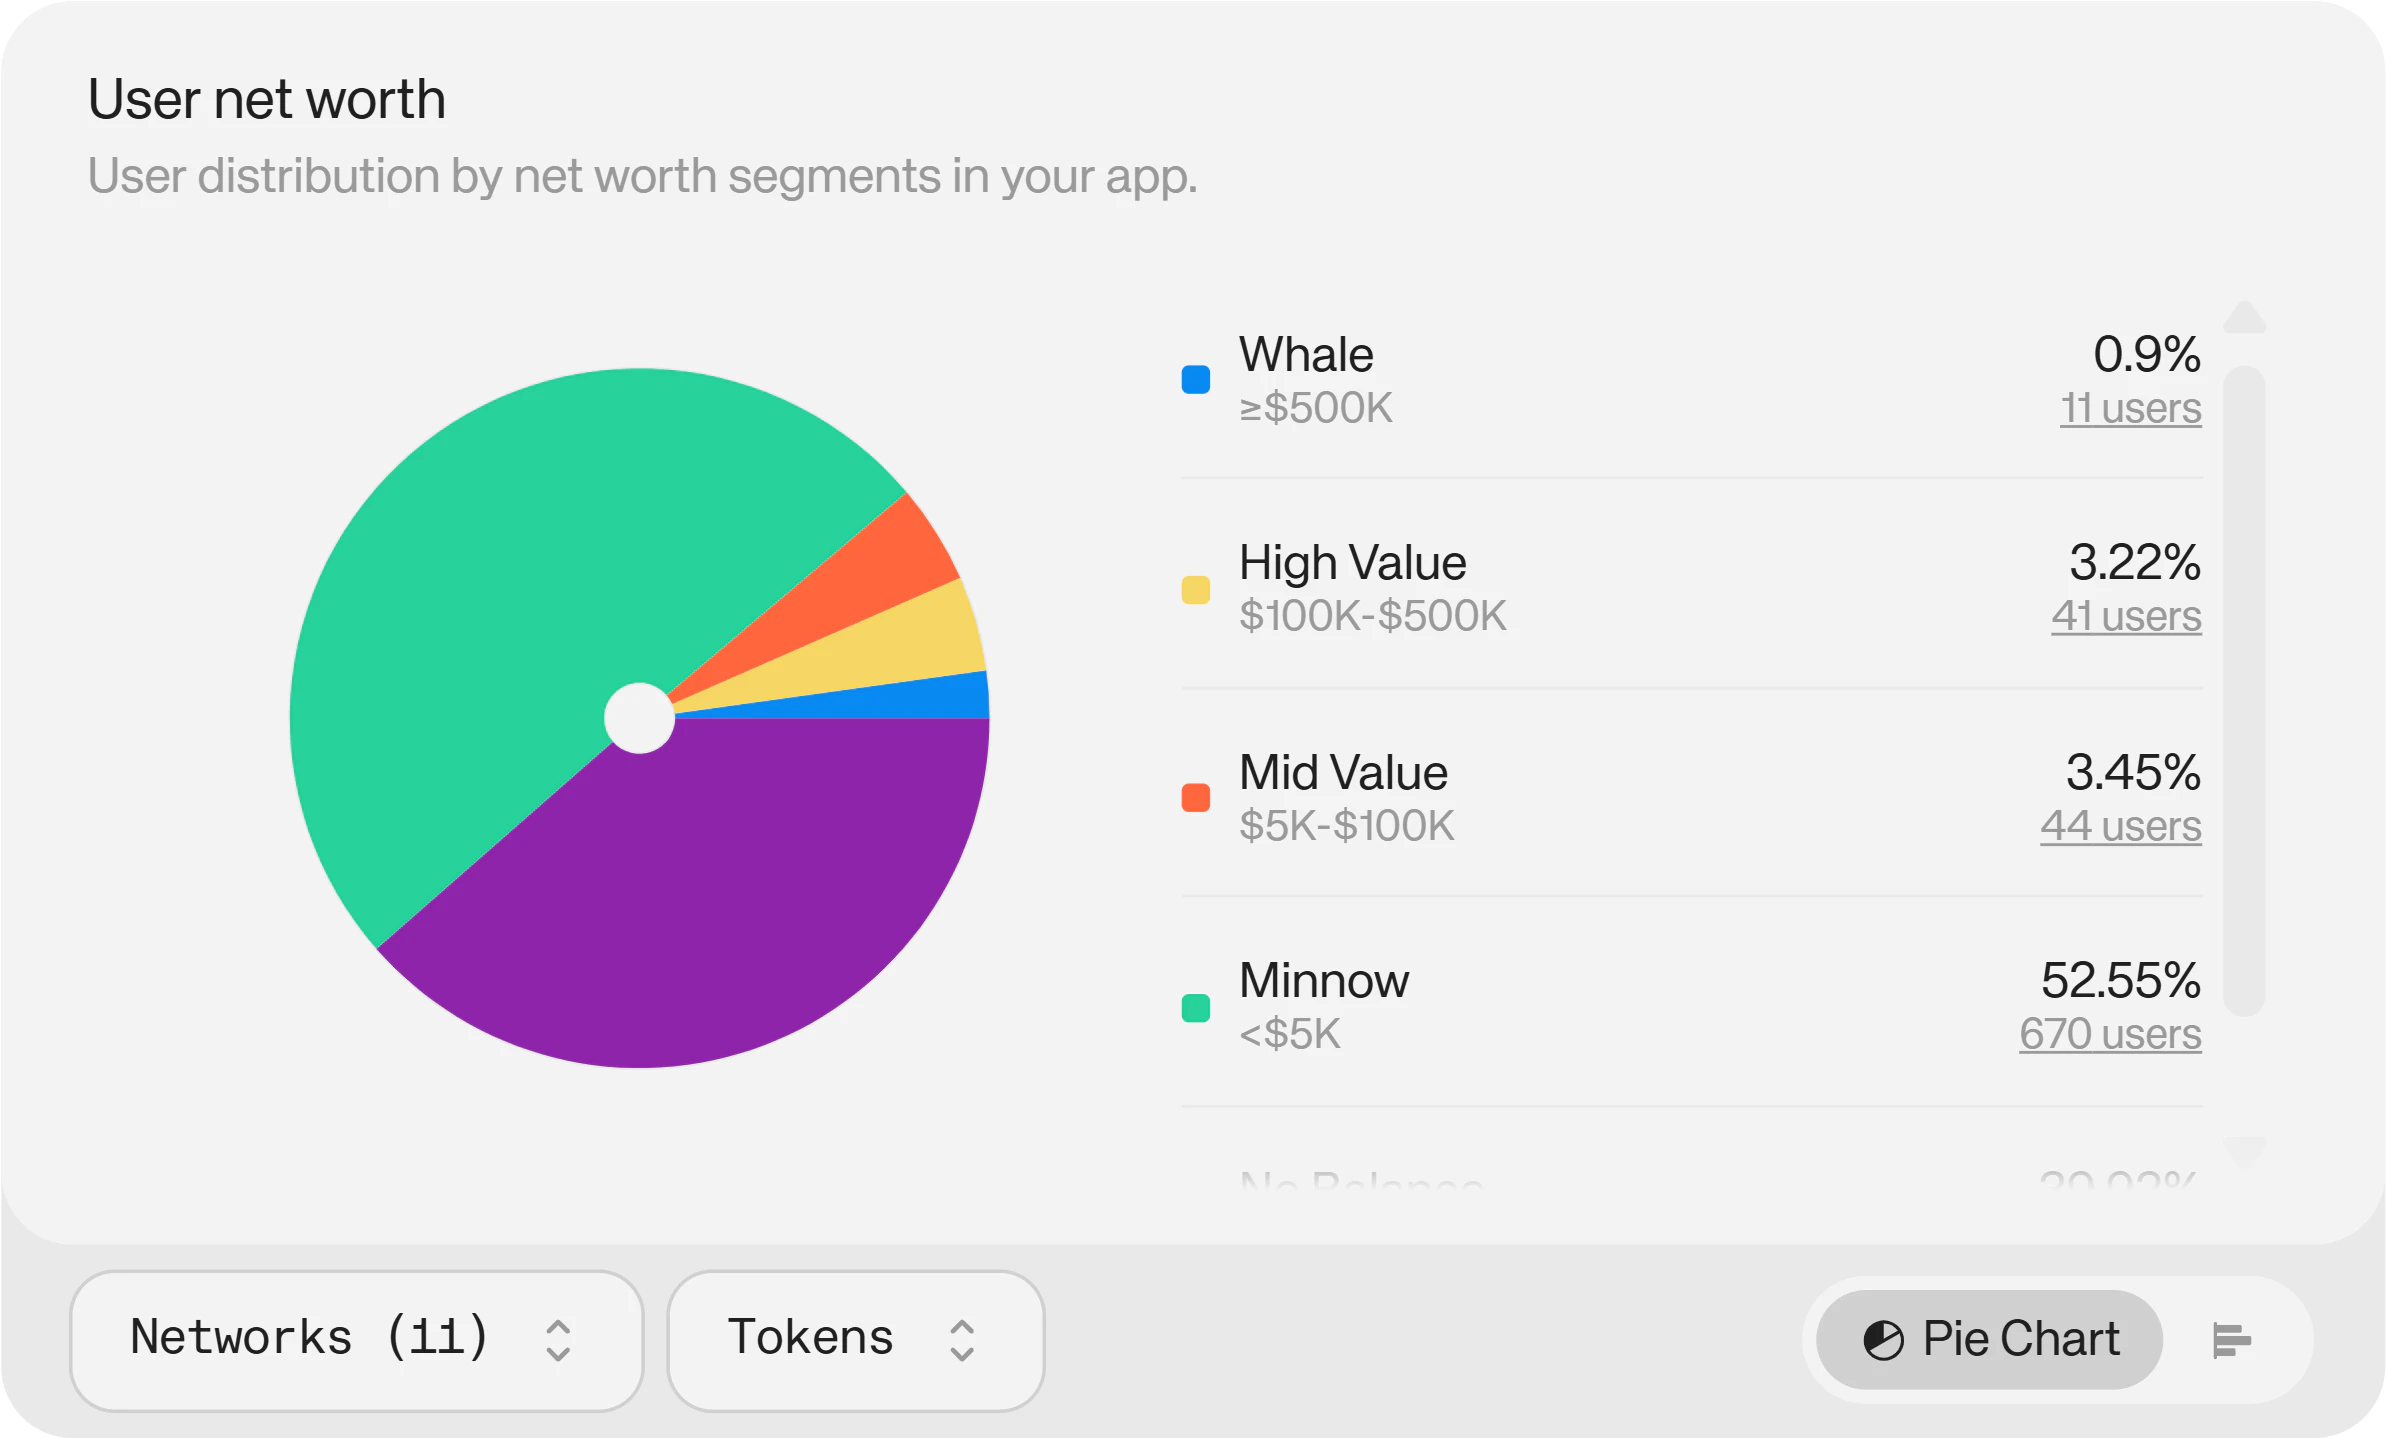
The user net worth chart shows valuable insights into your high value users, categorizing them by their onchain wealth. The data can be filtered by token holdings and network to surface which assets your highest value users hold and where.
Available on Enterprise plans. (Not available on Starter or Pro plans)
#### User Net Worth
The user net worth chart shows valuable insights into your high value users, categorizing them by their onchain wealth. The data can be filtered by token holdings and network to surface which assets your highest value users hold and where.
Available on Enterprise plans. (Not available on Starter or Pro plans)
 #### Wallet Intelligence
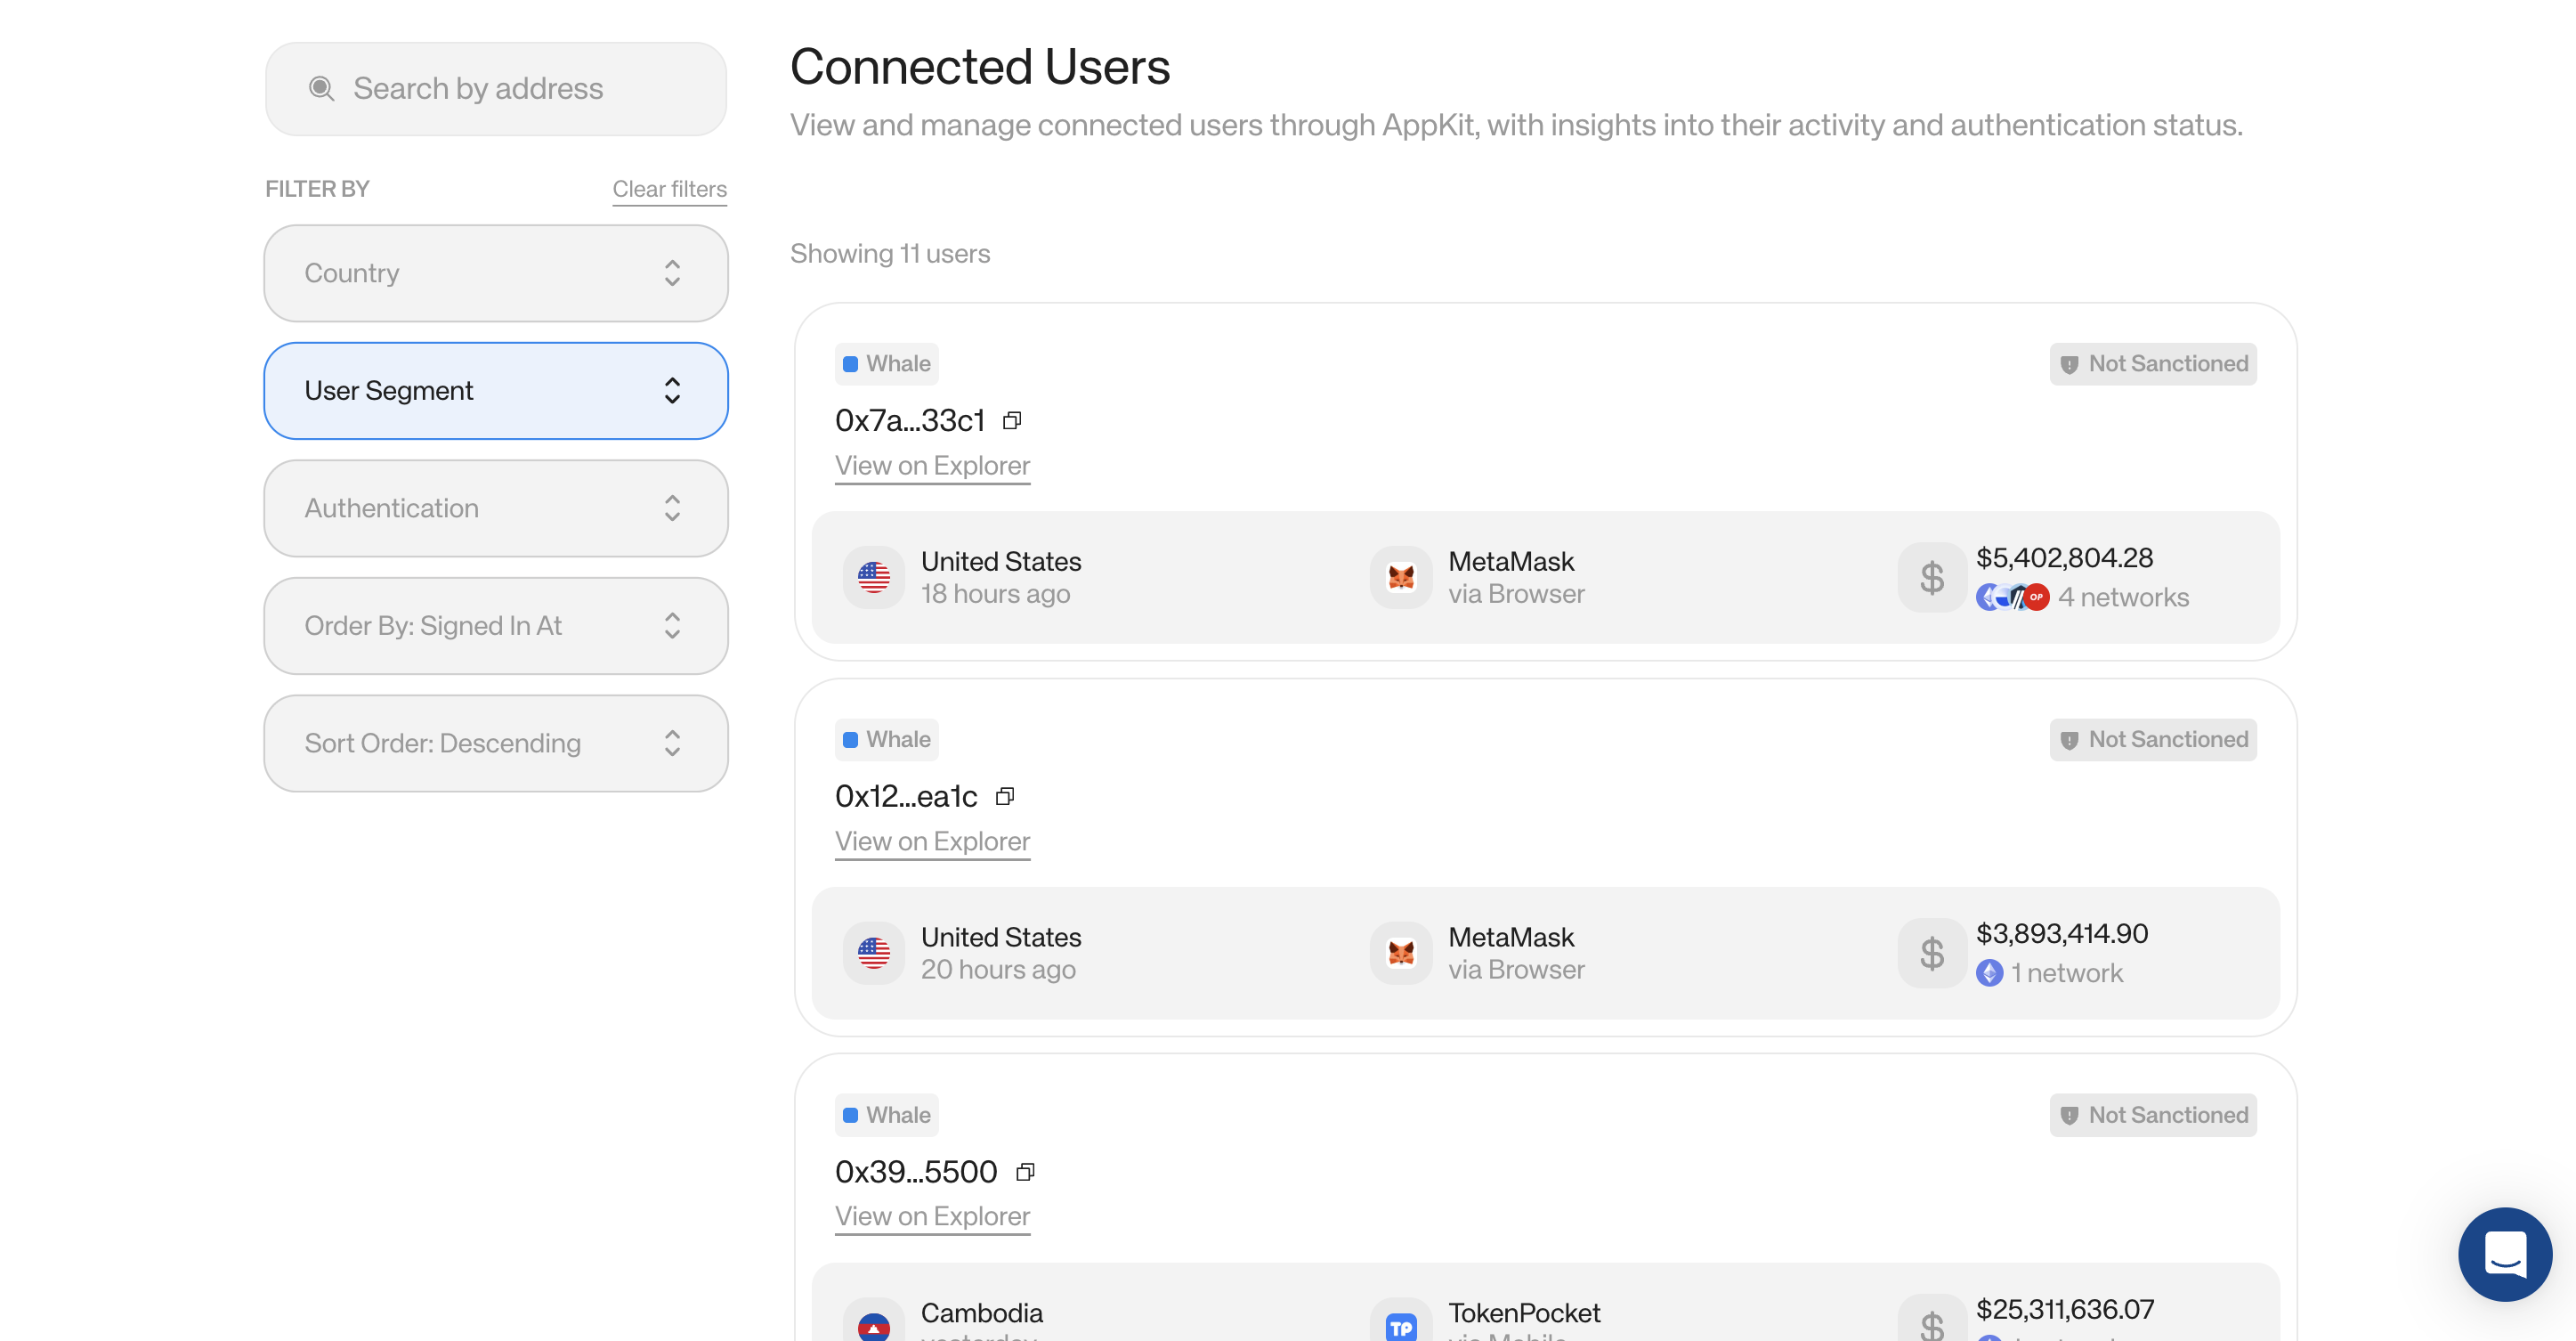
Wallet Intelligence gives you valuable insights into each of your individual users' behavior, activity, authentication status, holdings and more.
Filter connected users by:
* **Country** – to gain deeper geographical insights
* **Net worth segment** – to identify and research your whales and high-value users
* **Authentication status** – to understand which method of authentication specific users choose
Plus, gain insights on each connected user including:
* Their token holdings
* The networks they hold tokens on
* The wallets they use to connect
* A blockchain explorer link for further insights
Available on Enterprise plans only. (Not available on Starter or Pro plans)
#### Wallet Intelligence
Wallet Intelligence gives you valuable insights into each of your individual users' behavior, activity, authentication status, holdings and more.
Filter connected users by:
* **Country** – to gain deeper geographical insights
* **Net worth segment** – to identify and research your whales and high-value users
* **Authentication status** – to understand which method of authentication specific users choose
Plus, gain insights on each connected user including:
* Their token holdings
* The networks they hold tokens on
* The wallets they use to connect
* A blockchain explorer link for further insights
Available on Enterprise plans only. (Not available on Starter or Pro plans)
 #### App Co-usage
The App co-usage chart gives valuable insights into the other apps your audience uses.
Available on Enterprise plans. (Not available on Starter or Pro plans) **COMING SOON!**
### Swaps
Under the **Swaps** tab, you'll find information about how your users are swapping crypto in your app.
#### Total Swaps
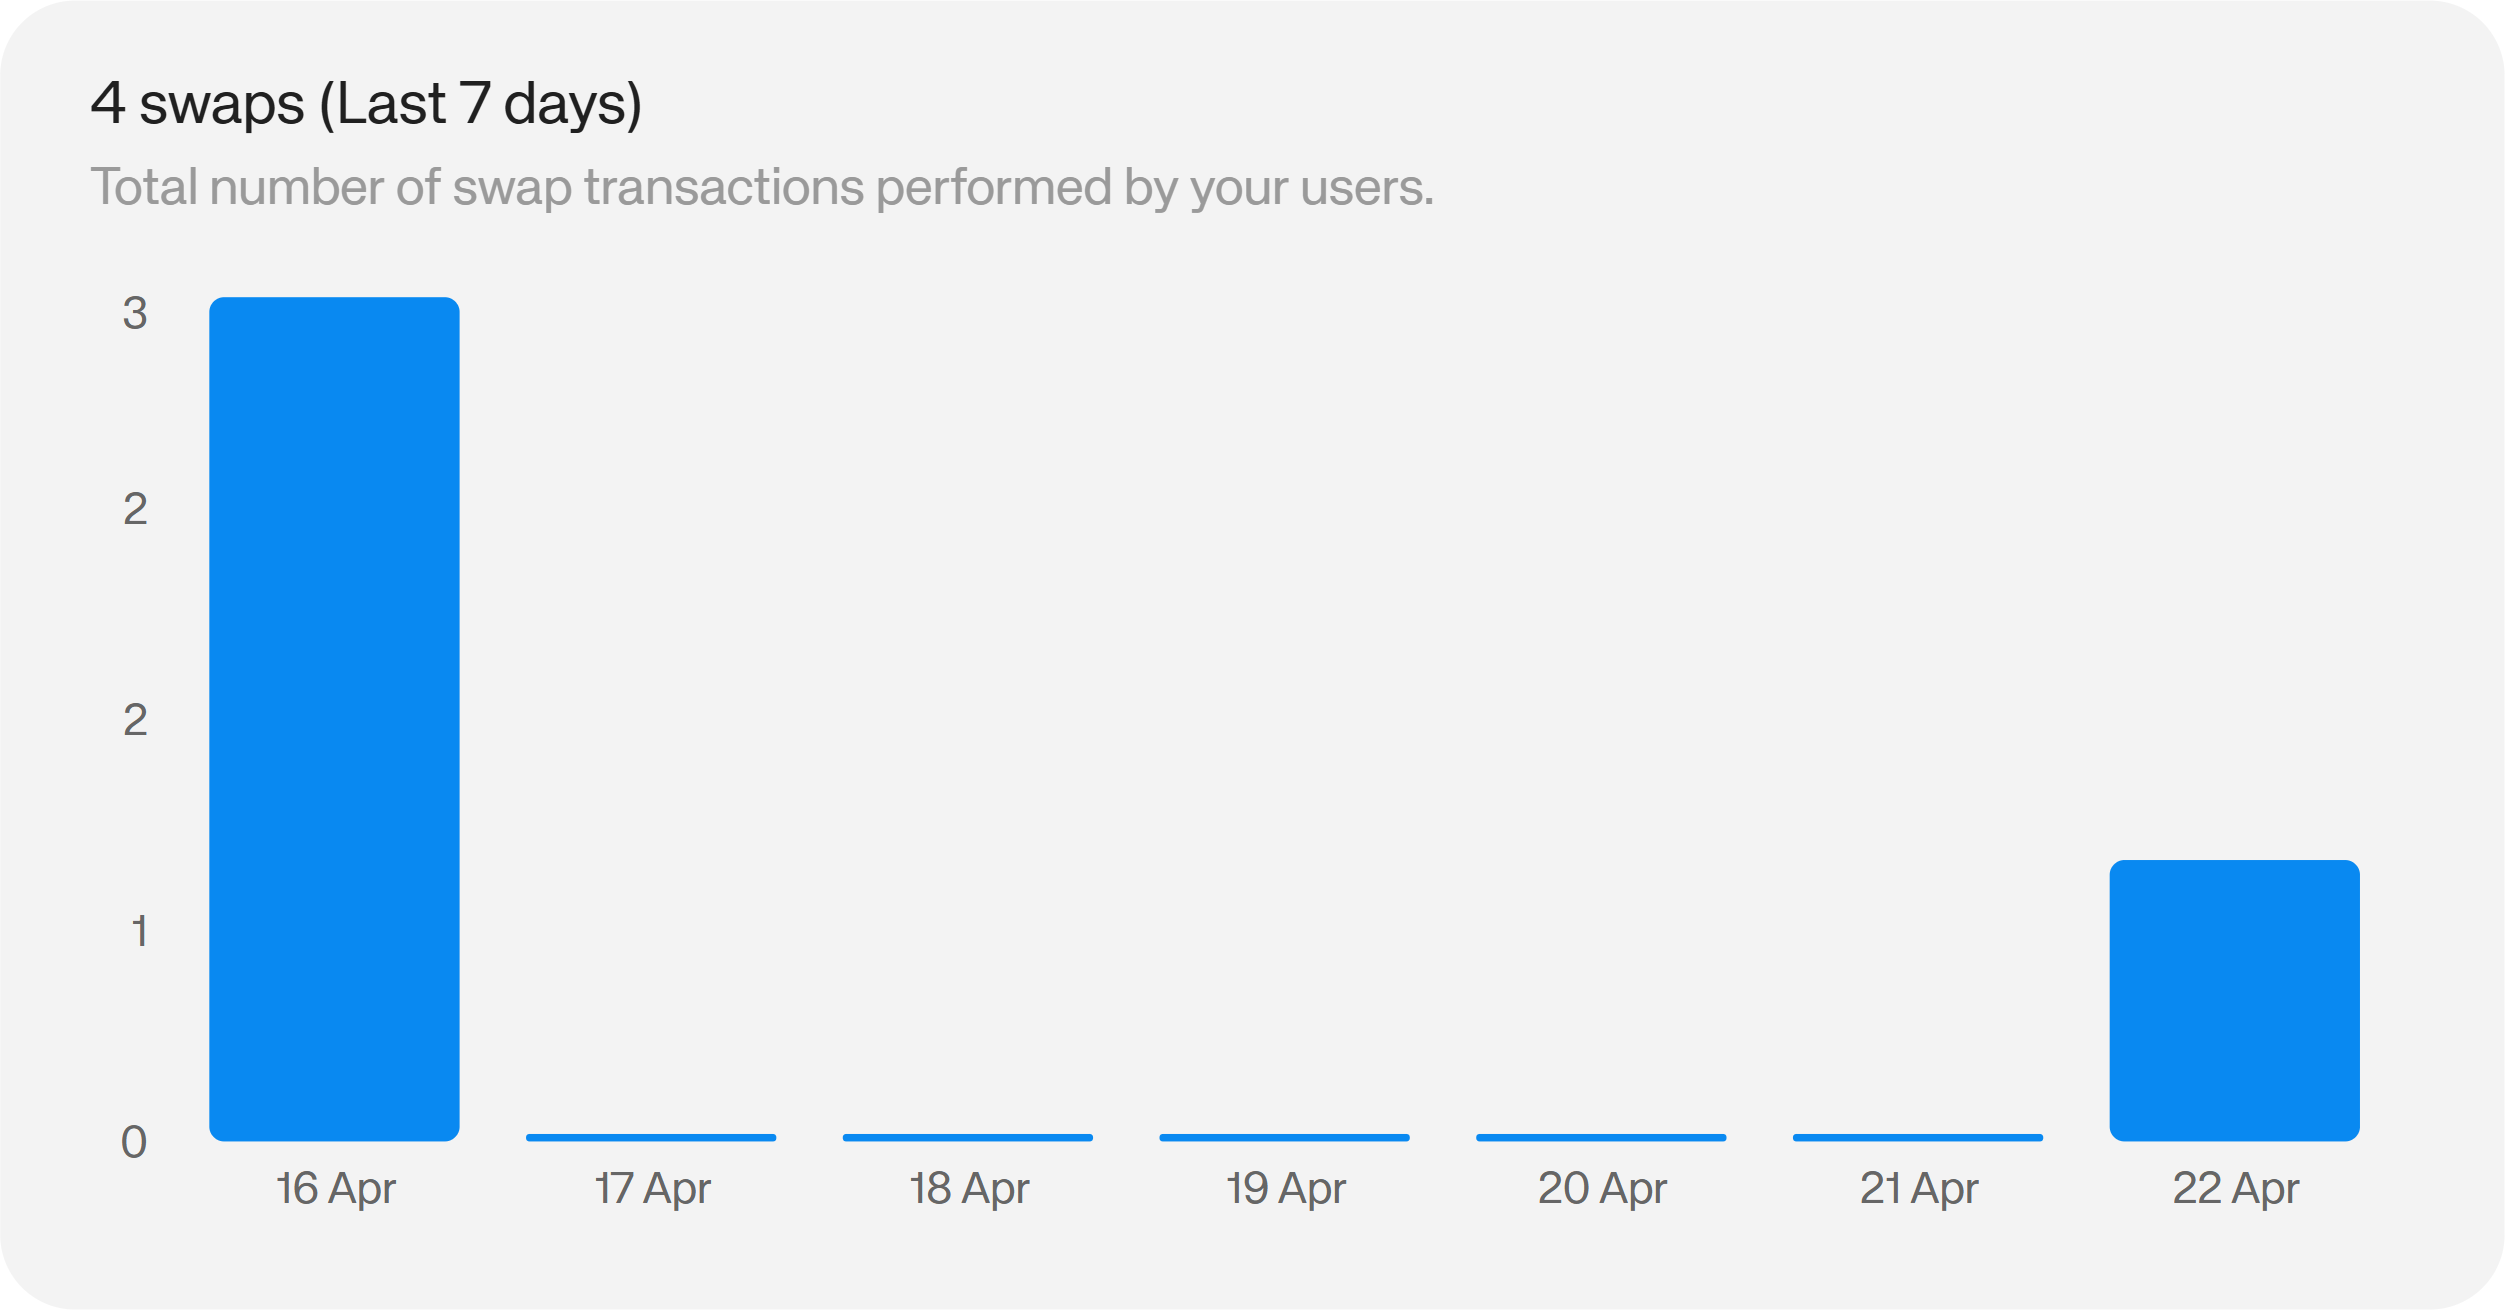
The total swaps chart shows you the total number of swaps your app has facilitated in a given period.
On Starter and Pro, you have access to the 7 day history. On Enterprise, you have the full history, filterable by Week, Month, Quarter, Year or All time.
#### App Co-usage
The App co-usage chart gives valuable insights into the other apps your audience uses.
Available on Enterprise plans. (Not available on Starter or Pro plans) **COMING SOON!**
### Swaps
Under the **Swaps** tab, you'll find information about how your users are swapping crypto in your app.
#### Total Swaps
The total swaps chart shows you the total number of swaps your app has facilitated in a given period.
On Starter and Pro, you have access to the 7 day history. On Enterprise, you have the full history, filterable by Week, Month, Quarter, Year or All time.
 #### Swap Volume
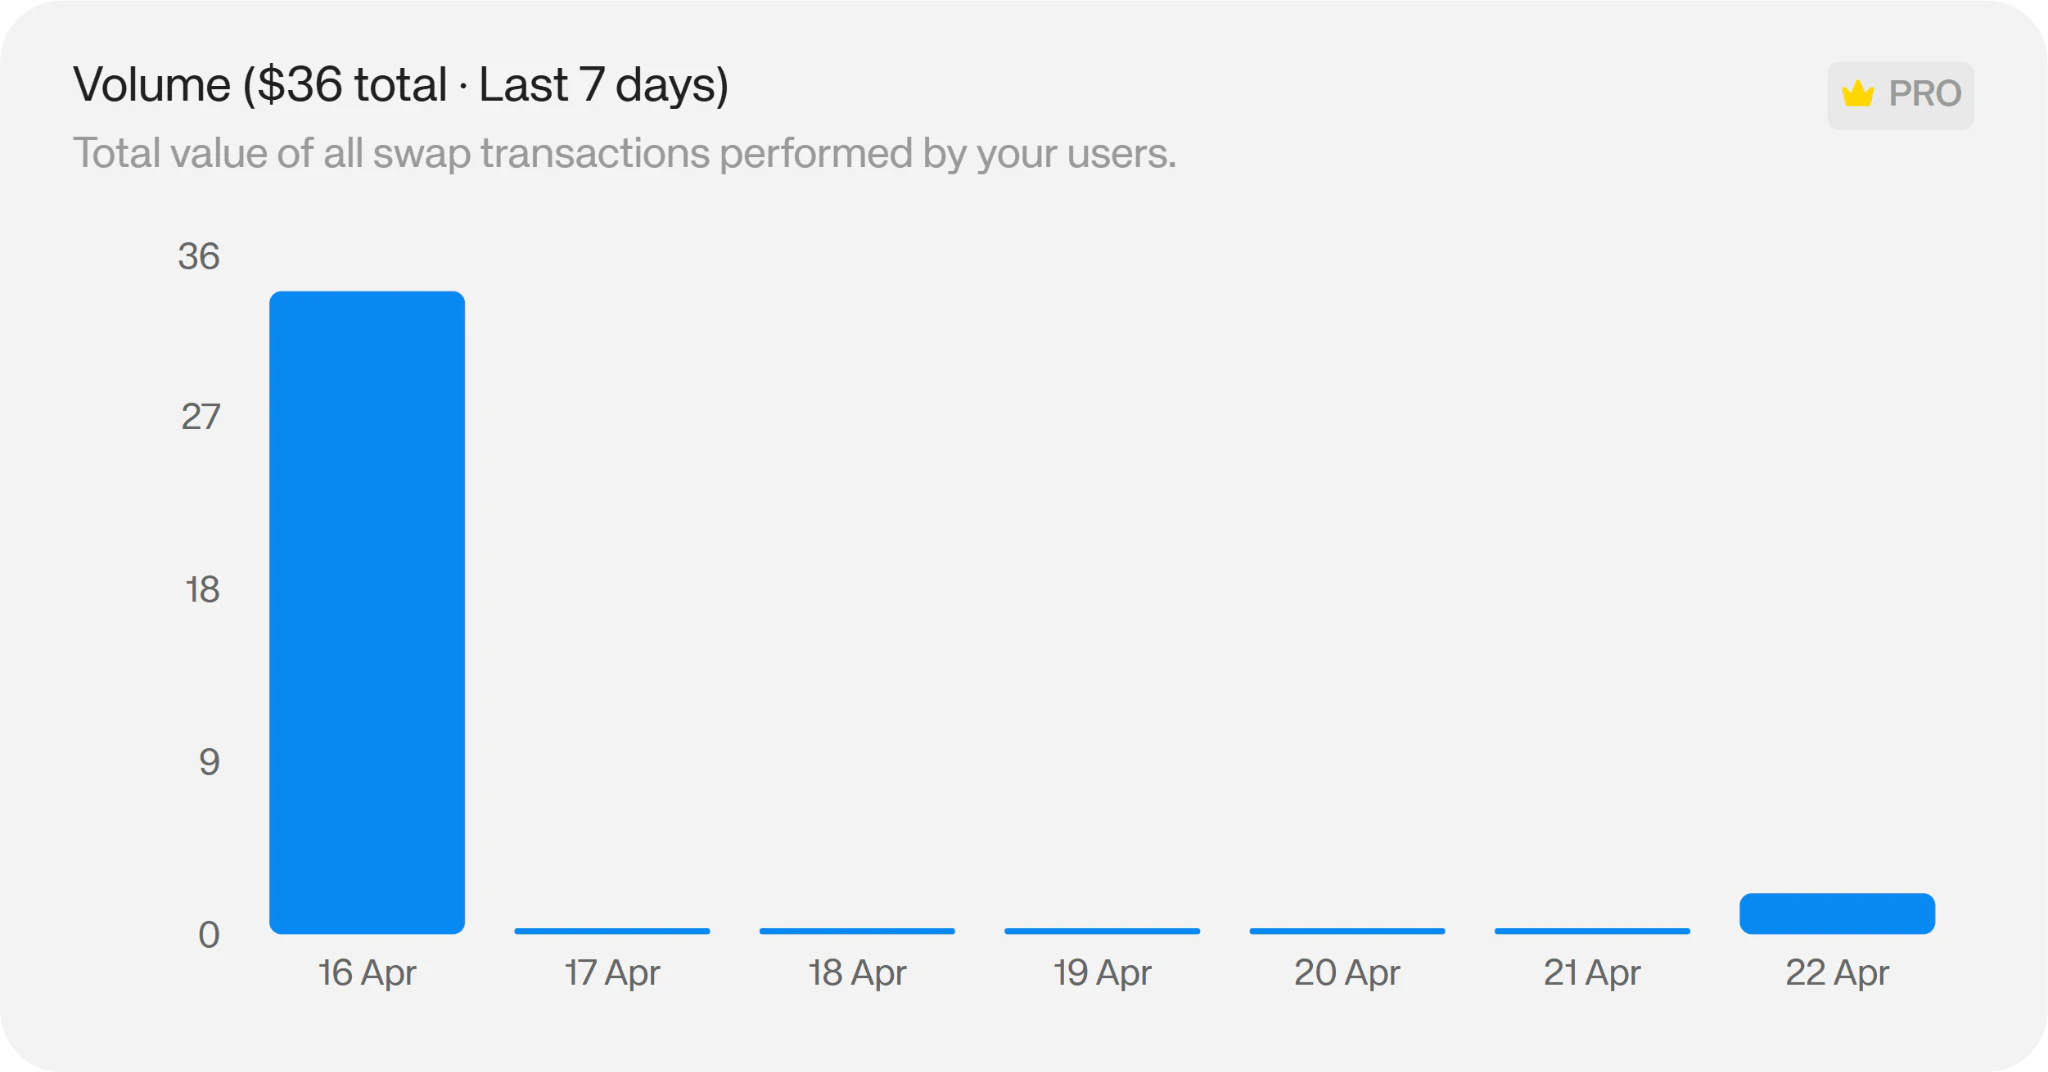
The swap volume chart shows you the volume generated in your app via swaps for a given period.
On Starter and Pro, you have access to the 7 day history. On Enterprise, you have the full history, filterable by Week, Month, Quarter, Year or All time.
#### Swap Volume
The swap volume chart shows you the volume generated in your app via swaps for a given period.
On Starter and Pro, you have access to the 7 day history. On Enterprise, you have the full history, filterable by Week, Month, Quarter, Year or All time.
 #### Swap Pairs
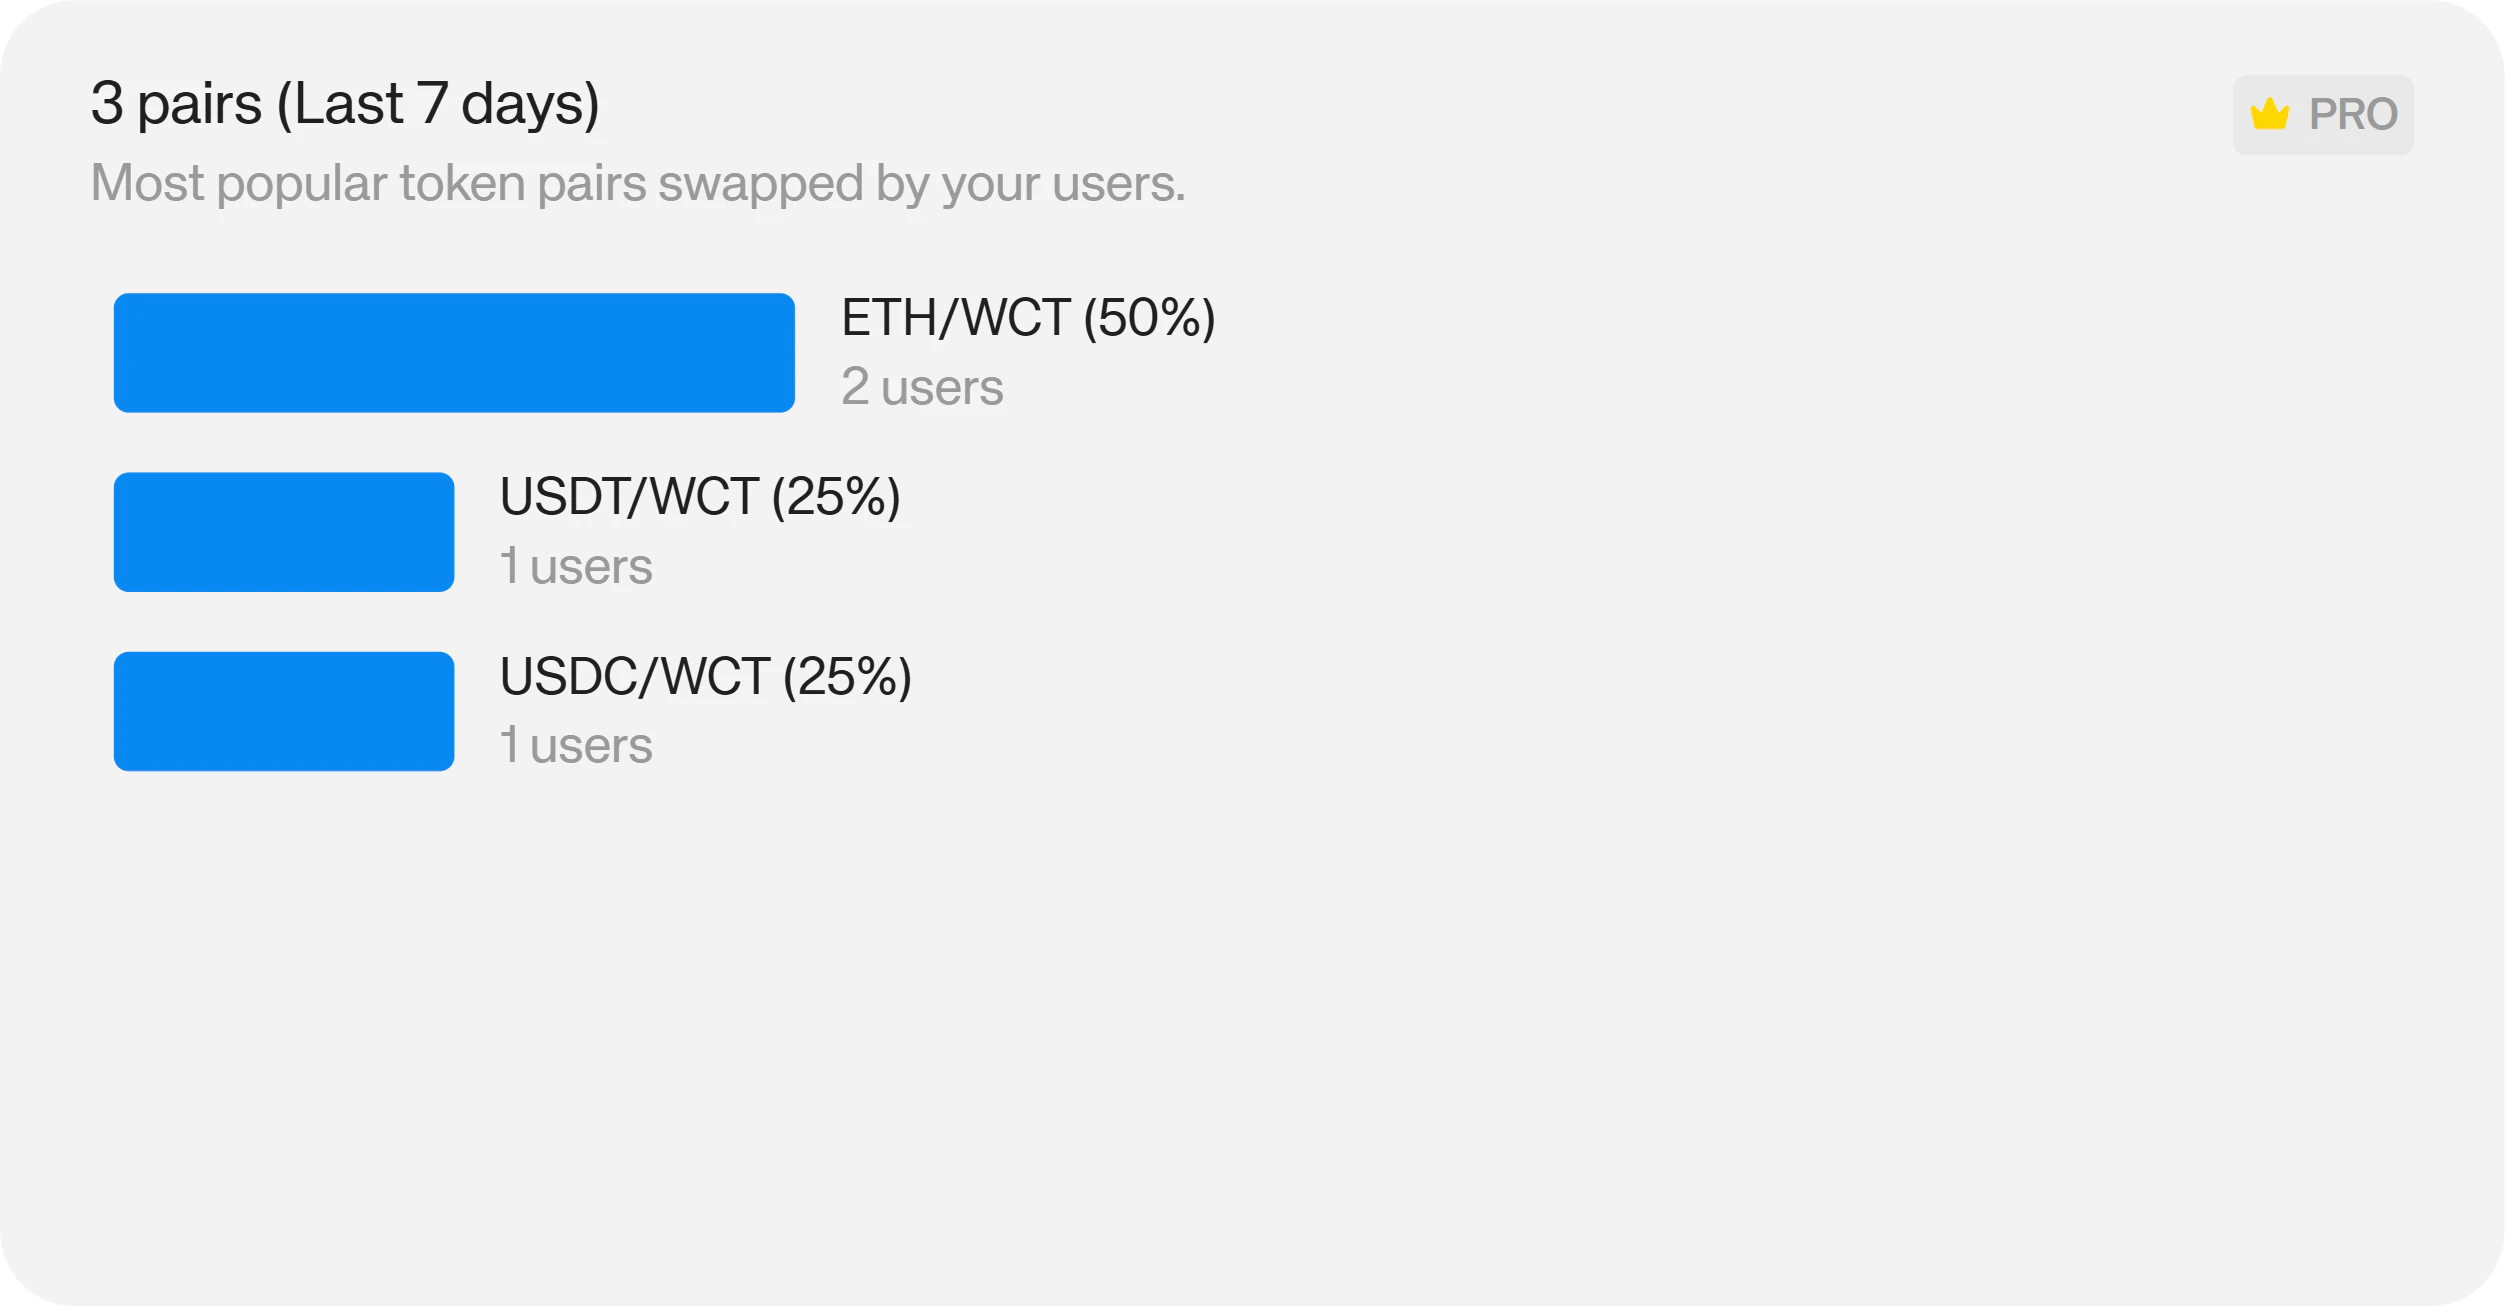
The swap pairs chart shows you the top cryptocurrencies users are swapping to and from in a given period.
On Starter and Pro, you have access to the 7 day history. On Enterprise, you have the full history, filterable by Week, Month, Quarter, Year or All time.
#### Swap Pairs
The swap pairs chart shows you the top cryptocurrencies users are swapping to and from in a given period.
On Starter and Pro, you have access to the 7 day history. On Enterprise, you have the full history, filterable by Week, Month, Quarter, Year or All time.
 #### Swap Countries
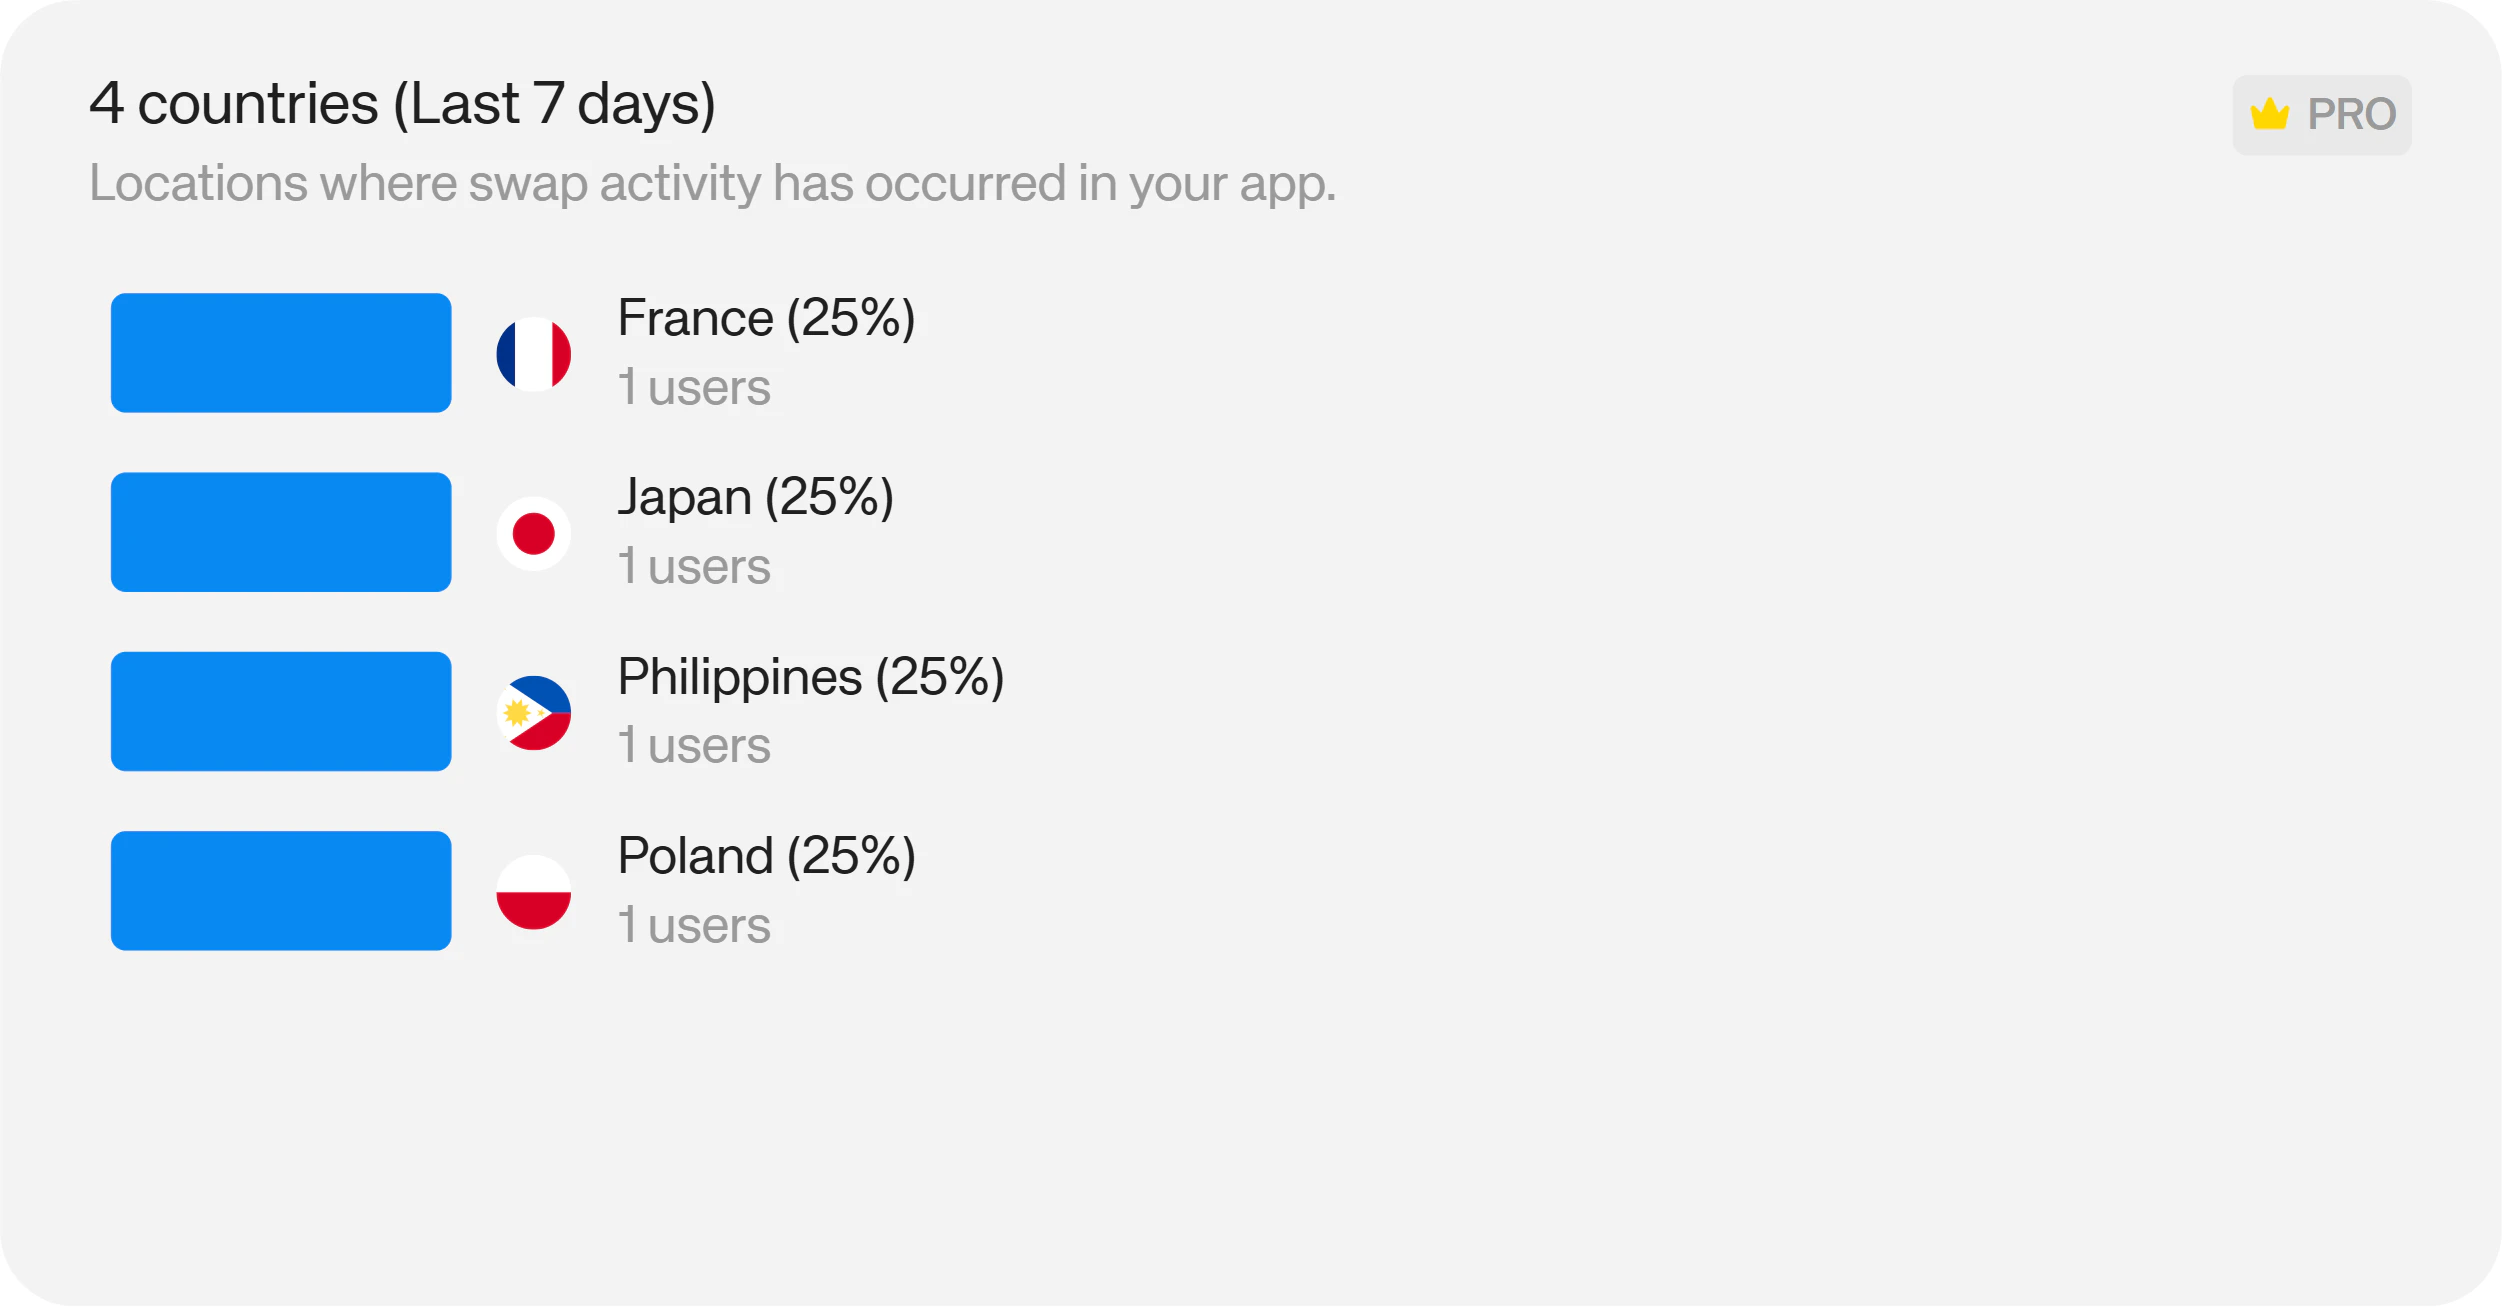
The swap countries chart shows you the top countries your users are swapping from in a given period.
On Starter and Pro, you have access to the 7 day history. On Enterprise, you have the full history, filterable by Week, Month, Quarter, Year or All time.
#### Swap Countries
The swap countries chart shows you the top countries your users are swapping from in a given period.
On Starter and Pro, you have access to the 7 day history. On Enterprise, you have the full history, filterable by Week, Month, Quarter, Year or All time.
 ### Onramp
Under the **Onramp** tab, you'll find information about how your users are buying crypto in your app.
#### Total Onramps
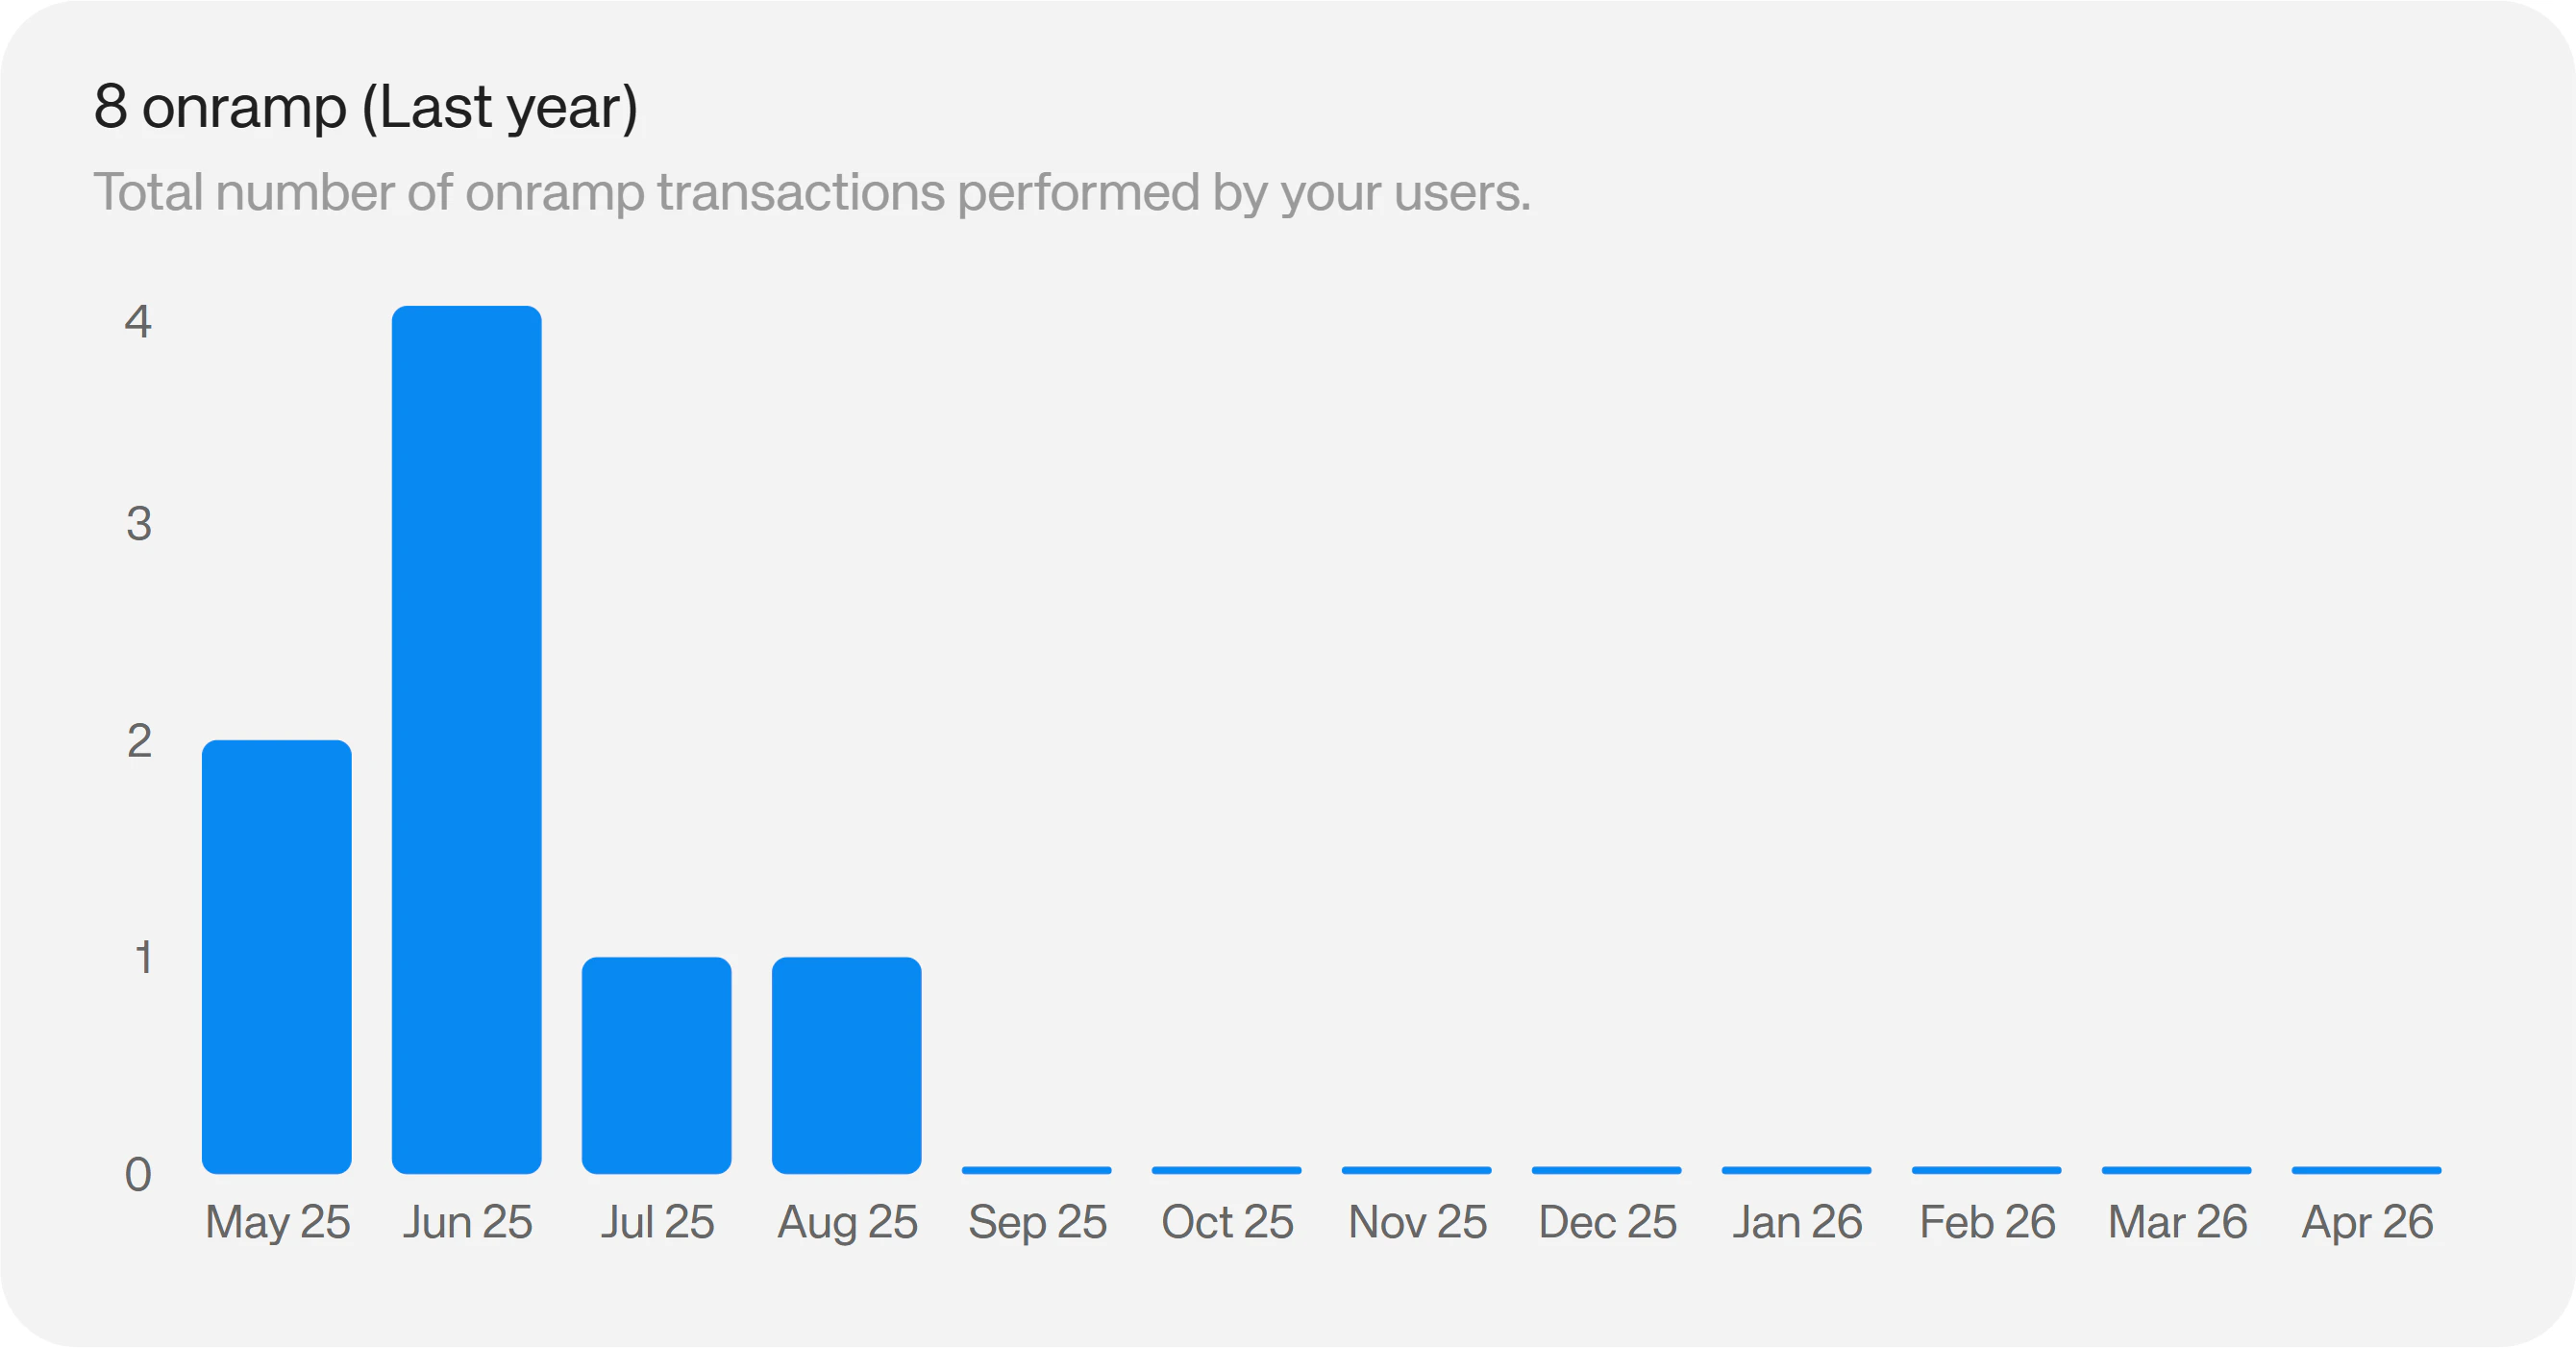
The total onramps chart shows you the total number of onramps your app has facilitated in a given period.
On Starter and Pro, you have access to the 7 day history. On Enterprise, you have the full history, filterable by Week, Month, Quarter, Year or All time.
### Onramp
Under the **Onramp** tab, you'll find information about how your users are buying crypto in your app.
#### Total Onramps
The total onramps chart shows you the total number of onramps your app has facilitated in a given period.
On Starter and Pro, you have access to the 7 day history. On Enterprise, you have the full history, filterable by Week, Month, Quarter, Year or All time.
 #### Onramp Volume
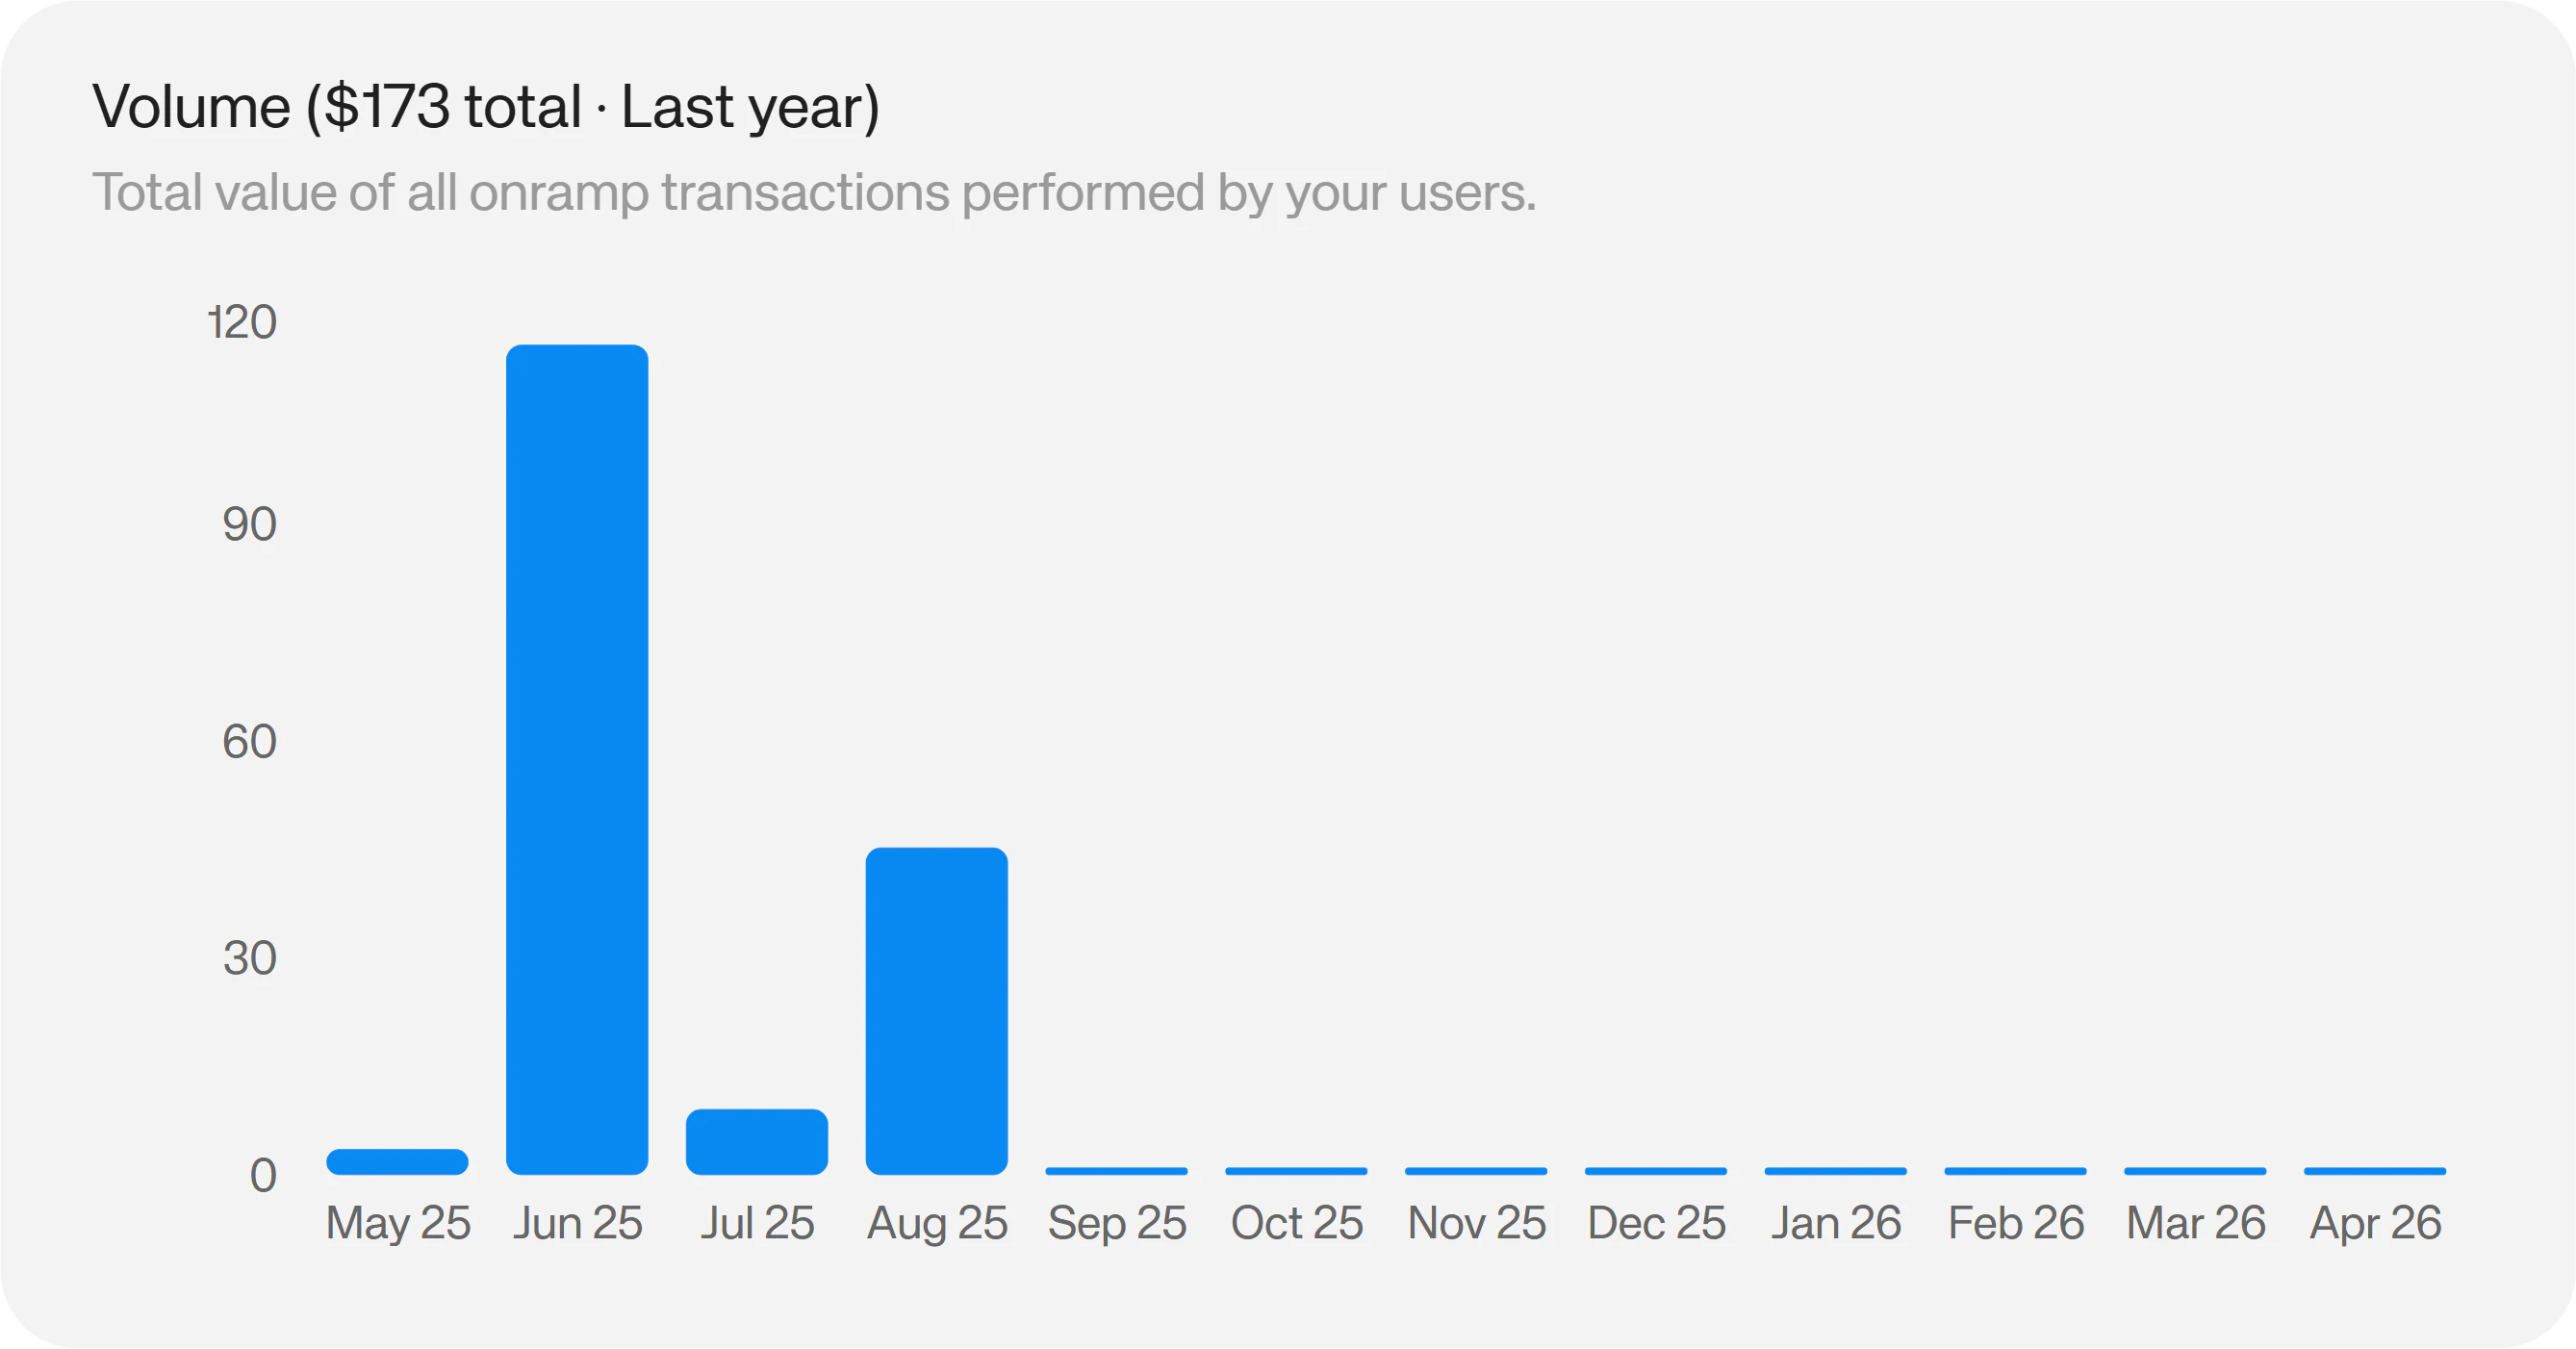
The onramp volume chart shows you the volume generated in your app via onramps for a given period.
On Starter and Pro, you have access to the 7 day history. On Enterprise, you have the full history, filterable by Week, Month, Quarter, Year or All time.
#### Onramp Volume
The onramp volume chart shows you the volume generated in your app via onramps for a given period.
On Starter and Pro, you have access to the 7 day history. On Enterprise, you have the full history, filterable by Week, Month, Quarter, Year or All time.
 #### Onramp Currencies
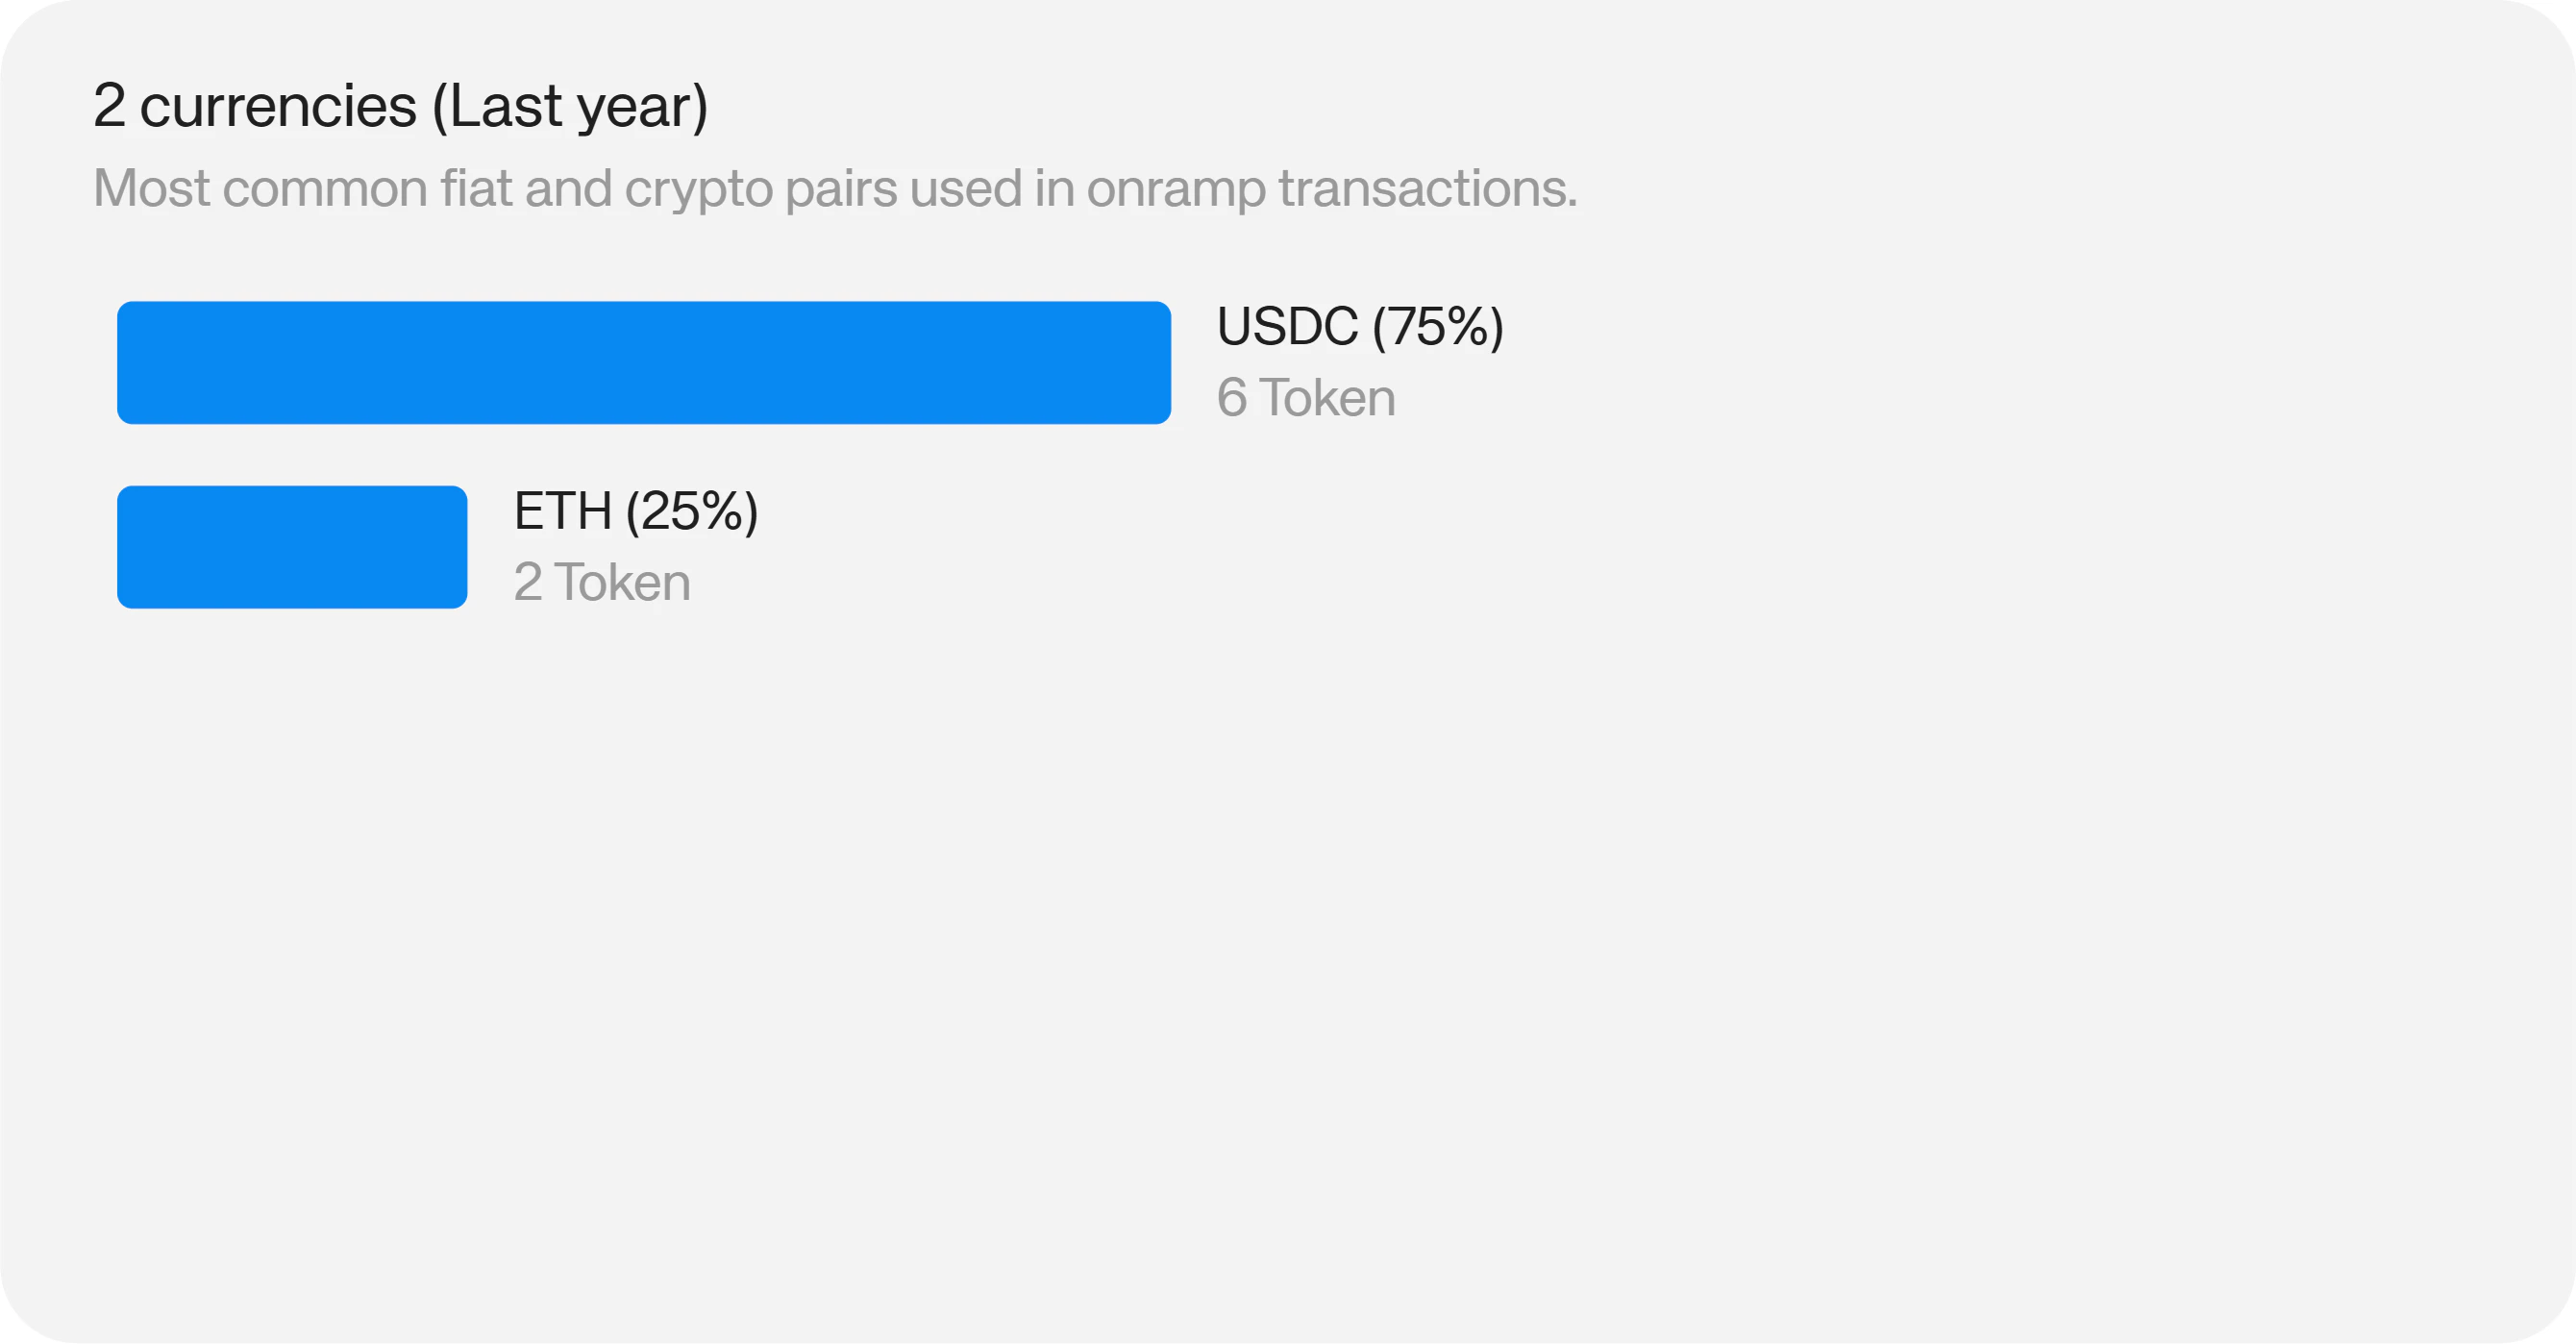
The onramp currencies chart shows you the top currencies your users are buying in a given period.
On Starter and Pro, you have access to the 7 day history. On Enterprise, you have the full history, filterable by Week, Month, Quarter, Year or All time.
#### Onramp Currencies
The onramp currencies chart shows you the top currencies your users are buying in a given period.
On Starter and Pro, you have access to the 7 day history. On Enterprise, you have the full history, filterable by Week, Month, Quarter, Year or All time.
 #### Onramp Countries
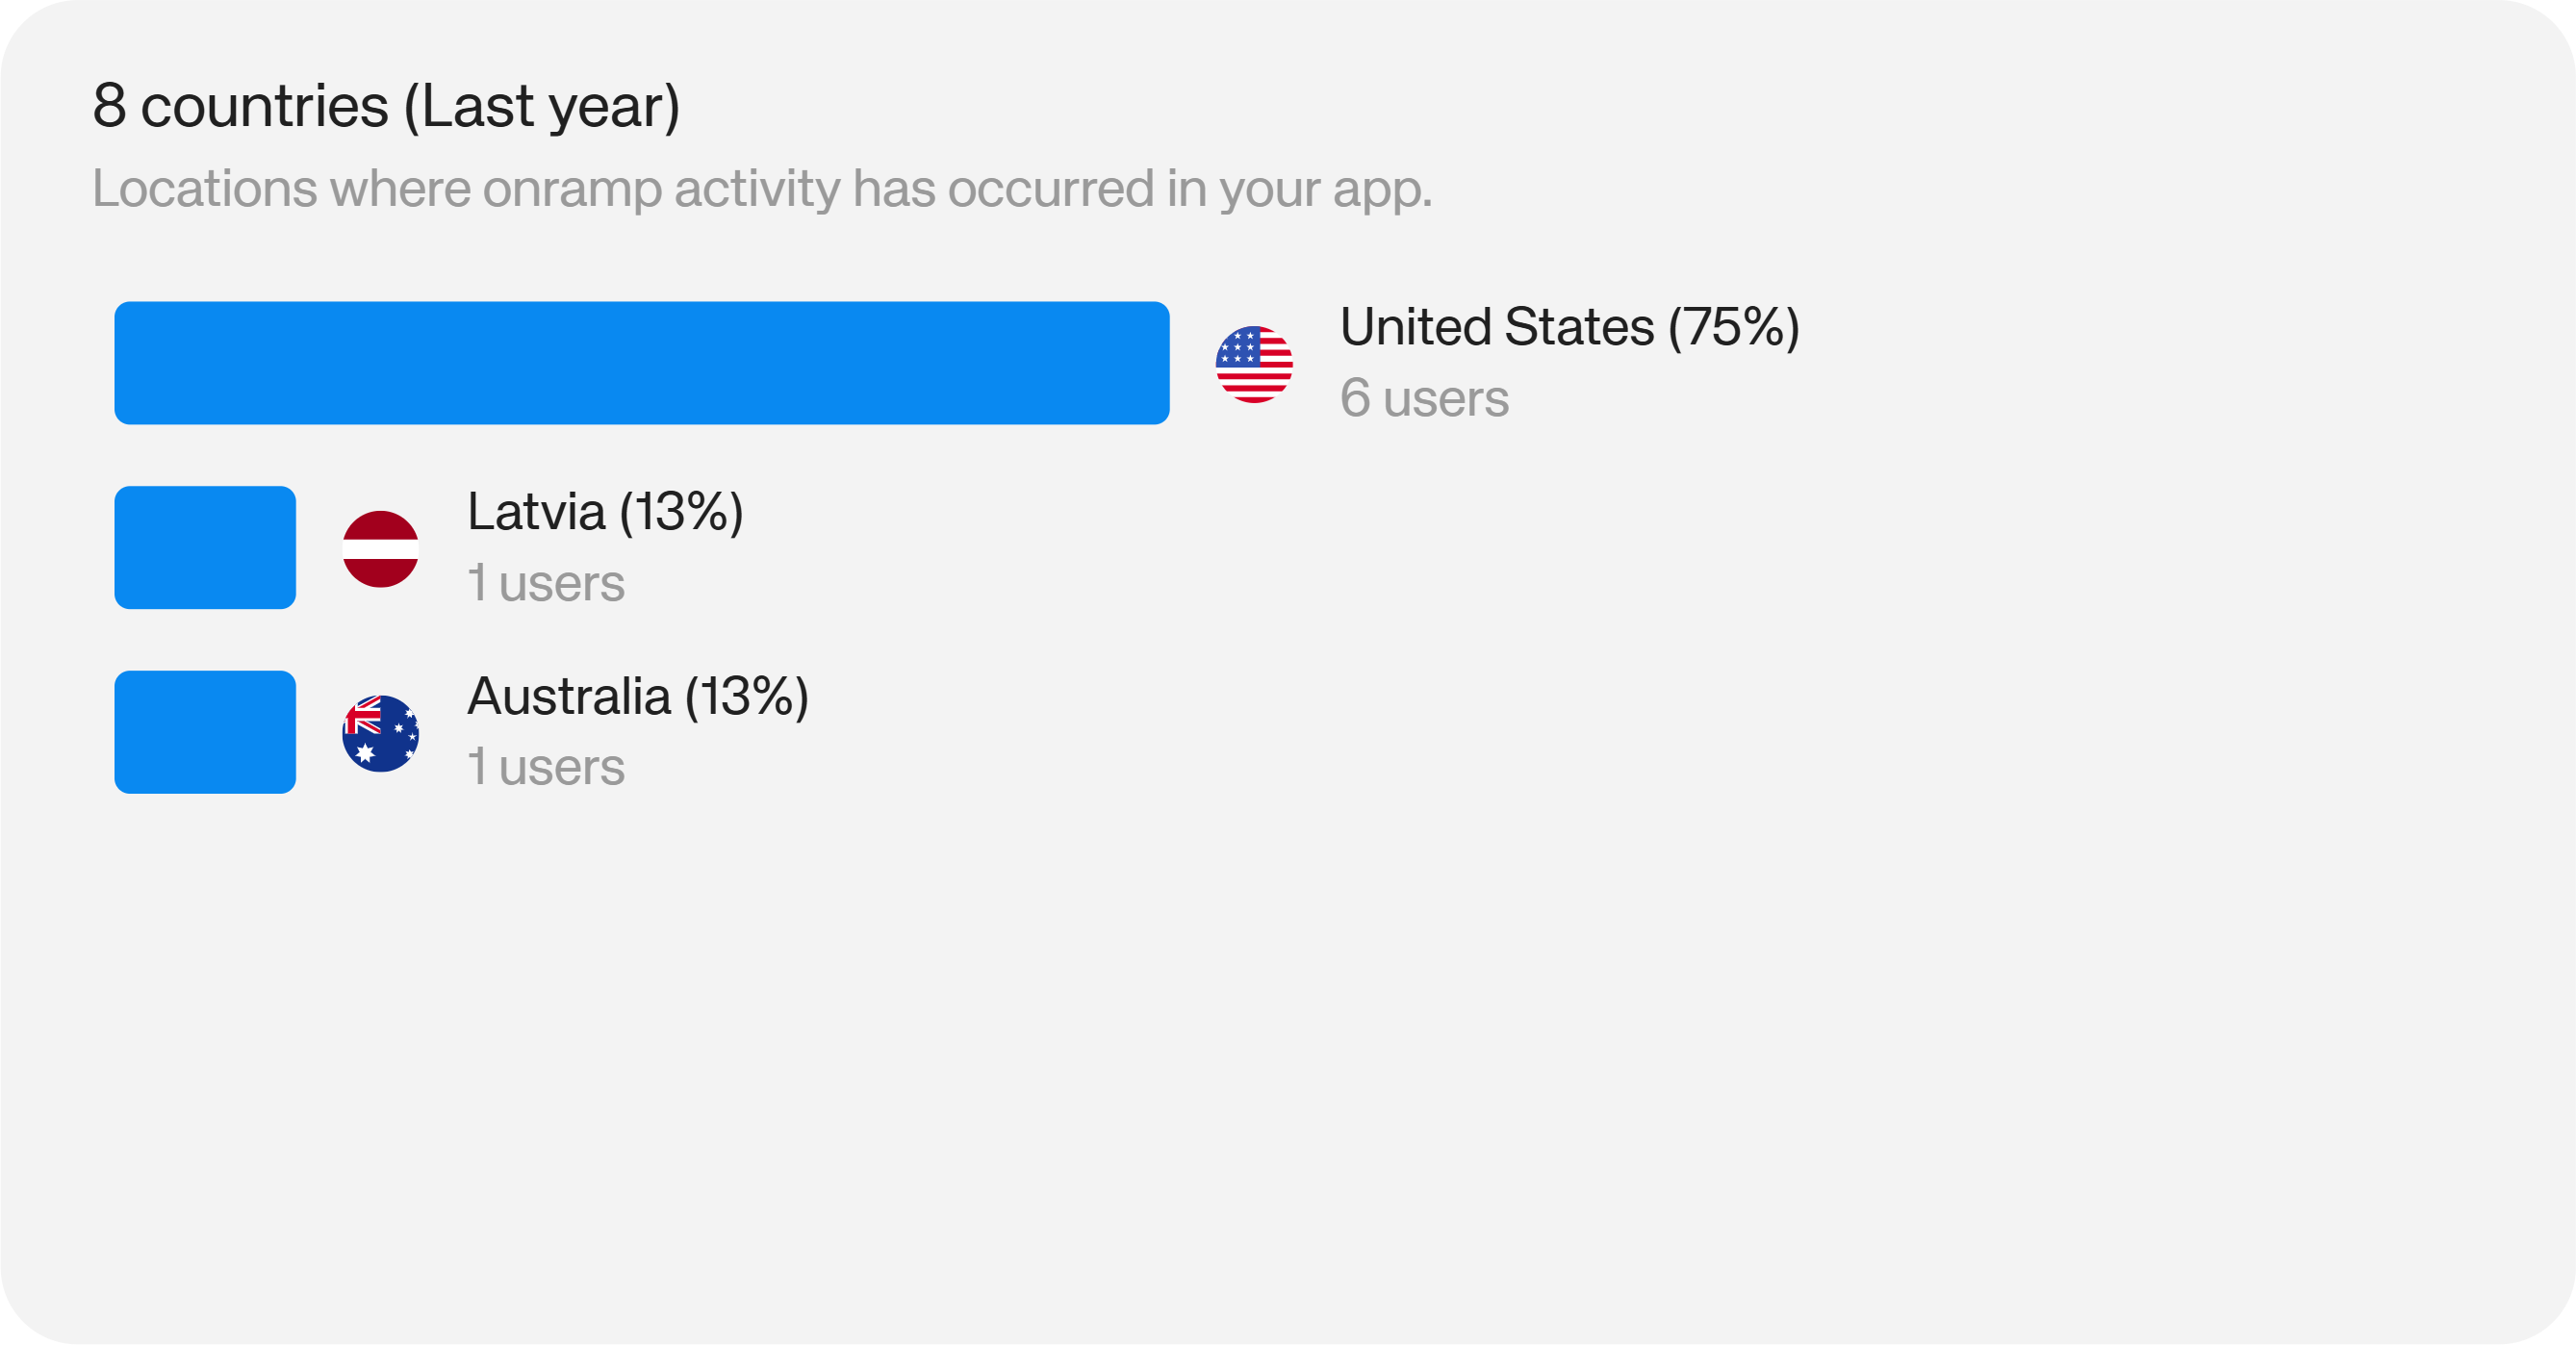
The onramp countries chart shows you the top countries your users are buying crypto from in a given period.
On Starter and Pro, you have access to the 7 day history. On Enterprise, you have the full history, filterable by Week, Month, Quarter, Year or All time.
#### Onramp Countries
The onramp countries chart shows you the top countries your users are buying crypto from in a given period.
On Starter and Pro, you have access to the 7 day history. On Enterprise, you have the full history, filterable by Week, Month, Quarter, Year or All time.